


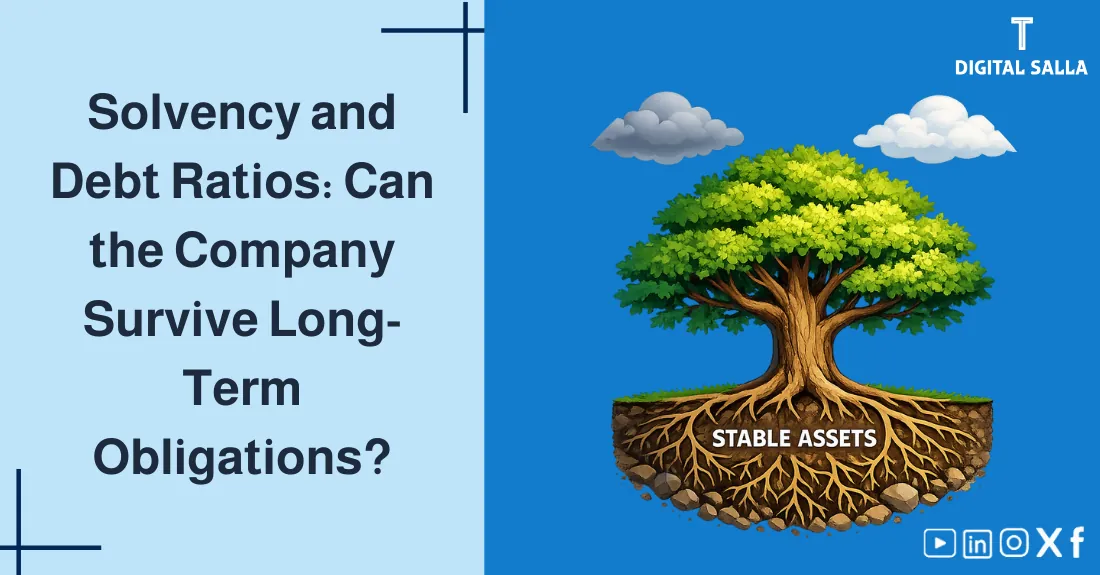
Solvency and Debt Ratios: Is the company able to survive and repay its long-term debts?
Solvency and Debt Ratios: Is the company able to survive and pay long-term debts?
Solvency Ratios measure the “robustness” of a company over the long term: How much does it rely on debt? Is Financial Leverage under control? Are profits and cash flows sufficient to cover interest and service debt? This guide explains the Debt Ratio and key solvency indicators, with a practical example and a quick calculator.
- The meaning of Solvency Ratios and what they reveal about financial risk.
- The practical difference between Solvency and Liquidity and why many confuse them.
- Key Solvency Ratios: Debt Ratio, Debt-to-Equity, Financial Leverage, Interest Coverage, and DSCR.
- Red Flags before expanding or negotiating financing.
- Interactive Calculator + Guideline description (Ok / Watch) for results.
1) What are Solvency Ratios?
Solvency Ratios measure a company’s ability to bear its long-term obligations and continue without excessive pressure from debt. The idea isn’t “Can I pay now?” but “Is the financing structure sustainable if conditions change: higher interest rates, slower sales, or fluctuating profits?”.
2) Solvency vs. Liquidity: The Difference That Changes Decisions
Solvency is often confused with Liquidity. Practically: Liquidity measures the ability to pay short-term obligations within the operating cycle, while Solvency measures the ability to “survive” with the debt structure over the long term.
| Dimension | Liquidity | Solvency |
|---|---|---|
| Focus | Short-term obligations | Long-term obligations and funding structure |
| Tools | Current/Quick/Cash Ratios | Debt Ratio/Leverage/Coverage/DSCR |
| Managerial Question | Can we “Pay Now” without choking? | Can we “Continue” without default risk? |
3) Key Solvency and Debt Ratios (Formulas & Interpretation)
Solvency ratios divide into two groups: (A) “Structure” ratios from the Balance Sheet (Debt/Equity/Leverage), and (B) “Service” ratios from the Income/Cash Flow Statement (Coverage/DSCR).
| Ratio | Formula | What does it reveal? | Practical Note |
|---|---|---|---|
| Debt Ratio | Total Liabilities ÷ Total Assets | Percentage of assets funded by liabilities | Higher means greater reliance on debt/liabilities |
| Debt-to-Equity | Total Liabilities ÷ Total Equity | Extent of “Leverage” compared to capital | Heavily affected if equity is small |
| Equity Ratio | Total Equity ÷ Total Assets | Capital safety margin | Inversely related to Debt Ratio (roughly) |
| Financial Leverage (Equity Multiplier) | Total Assets ÷ Total Equity | How much “Asset” each unit of equity supports | Higher may boost return but increases risk |
| Long-term Debt to Capitalization | Long-term Debt ÷ (Long-term Debt + Equity) | Weight of long-term debt in funding | Useful when restructuring loans or funding expansions |
4) Solvency Map (SVG): From Balance Sheet to Risk
Ultimately, Solvency is read from the balance sheet equation: Assets = Liabilities + Equity. As the share of liabilities increases, leverage increases—and return might increase… but the level of Financial Risk rises with it.
5) Interest Coverage & Debt Service: Coverage & DSCR
“Structure” ratios tell you how much debt you have, but “Service” ratios tell you if you can afford this debt actually: Does operating profit cover interest? And does cash flow cover interest + principal?

Project Profitability Report - Excel Template
| Ratio | Common Formula | Meaning | When is it critical? |
|---|---|---|---|
| Interest Coverage | EBIT ÷ Interest Expense | How many times operating profit covers interest | With variable rate funding or volatile earnings |
| EBITDA Coverage | EBITDA ÷ Interest | Broader coverage (before D&A) for high asset intensity | Capital intensive industries/long projects |
| DSCR (Debt Service Coverage Ratio) | EBITDA (or OCF) ÷ (Interest + Principal) | Ability to service full debt during period | Evaluating long-term loans or project finance |
6) Practical Numerical Example
Assume simplified data for a company over a year:
| Item | Value |
|---|---|
| Total Assets | 120,000 |
| Total Liabilities | 80,000 |
| Total Equity | 40,000 |
| EBIT (Operating Profit) | 15,000 |
| EBITDA | 20,000 |
| Interest Expense | 3,000 |
| Principal Repayments | 7,000 |
| Indicator | Calculation | Result | Quick Read |
|---|---|---|---|
| Debt Ratio | 80,000 ÷ 120,000 | 66.7% | Medium/High reliance on liabilities (depends on industry) |
| Debt-to-Equity | 80,000 ÷ 40,000 | 2.00 | Every 1 equity is matched by 2 liabilities |
| Leverage (Assets/Equity) | 120,000 ÷ 40,000 | 3.00 | Return might improve… but risks are higher |
| Interest Coverage | 15,000 ÷ 3,000 | 5.0× | Relatively good ability to bear interest |
| DSCR | 20,000 ÷ (3,000 + 7,000) | 2.0× | Comfortable debt service in this example |
7) Solvency Ratios Calculator
Enter your numbers to get: Debt Ratio, Debt-to-Equity, Equity Ratio, Financial Leverage, Interest Coverage, and DSCR.
8) Linking Solvency to Profitability & Efficiency
Solvency isn’t read alone. The same debt level might be safe for a company with stable margins and strong flows, but dangerous for a company with weak or volatile margins. So link solvency indicators with Profitability and Operational Efficiency.
| Observation | Possible Explanation | Practical Action |
|---|---|---|
| High Debt but Good Coverage | Debt is “funded” by strong profit/flow capacity | Monitor interest sensitivity and keep flow safety margins |
| Medium Debt but Weak Coverage | Operating profit is low or volatile | Improve operations/pricing/cost reduction before extra funding |
| Debt-to-Equity deteriorating fast | New debt or equity erosion (losses/dividends/valuation) | Review dividend policy, funding plan, and capital structure |
9) Building a Professional Debt Schedule
When analyzing solvency, “Aggregate Numbers” aren’t enough. You need a schedule showing: Opening Balance, Drawdowns, Repayments, Interest, Closing Balance, and Maturity Profile (Short/Long). This makes Financial Risk interpretation more accurate—and facilitates refinancing or rescheduling negotiations.
10) Common Red Flags & How to Handle Them
- Weak or Negative Equity: Inflates Debt-to-Equity and makes any new debt riskier.
- Persistently Low Interest Coverage: Means operating profit provides insufficient safety margin against shocks.
- DSCR near 1 or lower: Higher default risk (debt service eats up cash flow).
- High Short-term Debt vs. Cash Flow: Refinancing/Facility renewal risks.
- Covenants under pressure: Even if no default occurs, stricter terms or higher pricing might be imposed.
11) Frequently Asked Questions (FAQ)
What are Solvency Ratios?
They are indicators measuring a company’s ability to survive and pay long-term obligations, such as Debt Ratio, Financial Leverage, Interest Coverage, and DSCR.
What is the difference between Solvency and Liquidity?
Liquidity relates to short-term obligations and the operating cycle, while Solvency relates to the long term, funding structure, and ability to bear debt.
Is a high Debt Ratio always bad?
Not always. It might be appropriate if profits and cash flows are stable and Coverage/DSCR are comfortable. What matters is Trend, Comparison, and Tolerance Scenarios.
What is the most important ratio when evaluating a long-term loan?
Usually a set is used: DSCR + Interest Coverage + Maturity Profile (Debt Schedule), because actual Debt Service matters more than just “Debt Amount”.
Should I use average Assets/Equity?
Preferable especially for growing or seasonal companies to reduce end-of-period bias, but some solvency ratios are calculated directly from balance sheet date for comparison.
12) Conclusion
Solvency Ratios help you understand company “robustness”: Debt Ratio and Leverage show funding structure, while Interest Coverage and DSCR show realistic debt service ability. The best reading comes from combining these ratios with Profitability, Liquidity, and Maturity Schedules—then testing shock scenarios.