


Spend Analysis – Excel Template
63.56 $
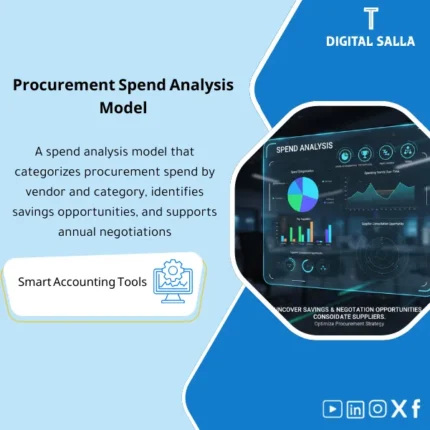
Spend Analysis: Classifies purchases by category and vendor, highlighting spend concentration, price trends, and variability. Delivers negotiation and cost-optimization opportunities for procurement and finance during budgeting cycles.
Spend Analysis
Spend Analysis Template to transform PO/AP data into a Spend Cube: Purchase analysis by supplier and item + Purchase price variance + Monitoring procurement spending with a deliverable guide file
Value Proposition: Spend Analysis becomes “unfeasible” when procurement data is scattered between POs and invoices, with non-standard supplier names and inconsistent item classifications; at that point, you cannot accurately respond: How much did we spend on item X? Which supplier accounted for the most spending? And do we have purchase price variance for the same item across different invoices? This Spend Analysis Template provides a practical pathway from data extraction → supplier standardization → item mapping → building the Spend Cube → generating reviewable and negotiable procurement reports.
In 20 Seconds: What Will You Get?
- Spend Analysis Template ready to build a Spend Cube from PO/AP in minutes after data import.
- Purchase analysis by supplier: Top suppliers + Tail spend + Spending distribution by entity/branch.
- Spend analysis by item: Clear classification (Category) linking items/accounts to negotiable purchase items.
- Supplier standardization: Revealing supplier name discrepancies and merging them (Normalization) to avoid “the same supplier multiple times.”
- Purchase price variance: Unit price variance for the same item/service across suppliers or periods.
- Monitoring procurement spending: Monthly/Quarterly spending with trend comparisons and exception flags.
- Delivery Pack: Dashboards + Support tables + Exceptions/Hypotheses list + Evidence index for PO/Invoice references.
CTA related to outputs: Receive Spend cube + Supplier/Category dashboards + Price variance ready for the meeting.
Suitable For
- Procurement / Category Managers: Preparing a negotiation file based on actual spend + price variance + supplier consolidation.
- Finance / Controller: Linking spending to GL accounts/cost centers and preparing reviewable spending reports.
- Internal Audit / Compliance: Tracking classification and supplier exceptions and documenting mapping hypotheses.
Not Suitable For
- If line-level PO/AP data cannot be extracted (at least Vendor + Amount + Date) — the analysis will turn into weak aggregate.
- If you want a BI platform with direct linking and real-time updates from ERP — this product is an Excel Template, not a BI system.
Without Analysis / With Analysis (Brief Comparison)
| Item | Without Spend Analysis | With Spend Analysis Template |
|---|---|---|
| Supplier Consolidation | The same supplier appears under multiple names | Supplier standardization + Merge/Exceptions list |
| Item Classification | “General” spending without clear Category | Spend analysis by item through documented Mapping |
| Prices | No measurement of Unit price variance | Purchase price variance with PO/Invoice references |
Before Use: 5 Symptoms That Procurement Spending Monitoring Is Unmanageable
- Spending reports rely on GL totals without line details, making it impossible to link spending to an actual supplier/item.
- Supplier names are non-standardized (Vendor variants) leading to misleading results: Top suppliers are not accurate.
- No consistent spend analysis by item; each team classifies in their own way, causing comparisons to be lost.
- Purchase price variance appears as a “feeling” rather than a report (the same item at different prices without evidence).
- During negotiations or contract renewals, work is based on a small sample instead of a complete reviewable spend baseline.
How Does Spend Analysis Work Practically from Data to Spend Cube?
The work here is not a “pretty Dashboard”; it is a series of steps ensuring that every number in the report can be traced back to its source: PO line or invoice line. It starts with extracting procurement/invoice data, then goes through a supplier standardization phase to consolidate the same supplier under a standard name, followed by mapping items/accounts to clear Categories to create spend analysis by item. Afterward, the Spend Cube is built (Vendor × Category × Time × Entity/Cost center) and reports such as purchase analysis by supplier and purchase price variance with PO/Invoice references are generated.
Implementation Method (3 Steps)
Step 1: Preparation and Report Collection
- Extract PO lines and/or AP invoice lines: (Vendor, Document#, Date, Item/Service, Qty, Unit price, Amount, Currency, Company/Branch/Cost center if available).
- Extract Vendor master (Vendor code + vendor name) to facilitate supplier standardization and linking identifiers.
- Prepare an item dictionary (Items/GL/Descriptions) for use in Category mapping.
Step 2: Cleaning + Supplier Standardization + Item Mapping
- Clean core fields (dates, currencies, units, remove untraceable rows).
- Supplier Standardization: Create “Vendor standard name” + record merge/exception cases (Merge list).
- Spend analysis by item: Mapping item/GL/description to Category/Sub-category with a record of “Unmapped/Needs review”.
- Establish rules for calculating Unit price (when Qty is present) to prepare purchase price variance.
Step 3: Building Spend Cube + Reports + Delivery Pack
- Build the Spend Cube (Vendor × Category × Month) with filtering capabilities by entity/branch/cost center.
- Generate Dashboards: Purchase analysis by supplier + Analysis by item + Monthly trends + Tail spend.
- Generate Operational Reports: Price variance list + List of potential suppliers for consolidation + List of unclassified items (Mapping backlog).
- Prepare Delivery Pack: Report + Support tables + Hypotheses/Exceptions + Evidence index for PO/Invoice references.
Template Components (Clear Inventory)
-
Spend Data Import (PO/AP)
- Practical Purpose: Import PO lines or AP invoice lines as the basis for analysis.
- When to Use: Monthly or quarterly based on the review cycle.
- Resulting Guide: Snapshot of source data that can be referenced for any questions.
-
Vendor Normalization
- Practical Purpose: Consolidate the same supplier under a standard name/code and show merge/duplication cases.
- When to Use: First time + Updates when adding suppliers/changing names.
- Resulting Guide: Merge list + Exceptions list for non-consolidatable suppliers.
-
Category Mapping
- Practical Purpose: Link items/categories/GL accounts to a comparable and negotiable purchase classification.
- When to Use: When building the analysis + updating when new items appear.
- Resulting Guide: Mapping table + Unmapped list needing decision.
-
Spend Cube Model
- Practical Purpose: Build an analytical structure (Vendor × Category × Time × Entity) for multiple reports without reprocessing.
- When to Use: After cleaning and mapping are complete.
- Resulting Guide: Data model traceable to PO/Invoice line.
-
Supplier Spend Report
- Practical Purpose: Extract Top suppliers/Tail spend and spending distribution by supplier and entity.
- When to Use: Monthly for review + before contract renewals and negotiations.
- Resulting Guide: Supplier spend table + Top 20/80-20 view.
-
Category Spend Report
- Practical Purpose: Highlight where spending occurs at the Category/Sub-category level and compare it across periods.
- When to Use: Quarterly + before budgeting.
- Resulting Guide: Category spend breakdown + trend lines.
-
Unit Price Variance
- Practical Purpose: Measure unit price differences for the same item/service between suppliers or across periods, with references.
- When to Use: Before negotiations + when reviewing purchase exceptions.
- Resulting Guide: Price variance list linked to PO/Invoice references.
-
Monitoring Pack
- Practical Purpose: Prepare a periodic “Pack” for meetings: spend summary + exceptions + mapping backlog.
- When to Use: Monthly/Quarterly.
- Resulting Guide: Spend review pack + Evidence index + Sign-off (Prepared/Reviewed).
What Should Be Included in the Delivery?
- 01-Spend-Analysis-Template.xlsx: The main template file (Imports + Model + Dashboards).
- 02-PO-AP-Import-Template.xlsx: PO/AP line-level import template with required fields.
- 03-Vendor-Normalization-Map.xlsx: Vendor standardization (Vendor code/name → Standard vendor) + Merge list.
- 04-Category-Mapping-Table.xlsx: Mapping items/GL/Descriptions to Categories/Sub-categories + Unmapped queue.
- 05-Spend-Cube-DataModel.xlsx: Data model (Vendor × Category × Time × Entity) + Trace fields.
- 06-Supplier-Spend-Report.xlsx: Purchase analysis by supplier (Top/Tail/Trend).
- 07-Category-Spend-Report.xlsx: Spend analysis by item (Category/Sub-category) + Trends.
- 08-Unit-Price-Variance-Report.xlsx: Purchase price variance + PO/Invoice references + Priority flags.
- 09-Vendor-Consolidation-List.xlsx: List of potential supplier consolidations + Justifications for merging.
- 10-Exceptions-Log.xlsx: Exceptions (Unclassified/Missing data/Currencies/Units) + Processing decision.
- 11-Evidence-Index.xlsx: Evidence index linking results to references (PO/Invoice/Vendor) + Retention paths.
- 12-Runbook.pdf: Step-by-step operation (Extract → Clean → Normalize → Map → Cube → Pack).
- 13-Controls-Checklist.pdf: Checklist for data controls before approval (Completeness/Uniqueness/Mapping).
- 14-Archiving-Map.docx: Retention tree (Year/Quarter/SpendAnalysis/Inputs/Outputs/Evidence) + Naming convention.
- 15-Signoff-Page.docx: Prepared/Reviewed/Approved + Period scope (e.g., Q3-2025).
After Implementation (Two Points Only)
- Operational Outcome for the Team: The procurement/finance meeting shifts from “discussing impressions” to a Pack: Supplier spend + Category spend + Price variance list + List of unclassified items needing decision.
- Control/Audit Outcome: Any number in the spending report can be traced back to the PO/Invoice line through the Evidence index, with a documented Mapping and Exceptions record (Traceability).
FAQ — Questions Before Purchase
Is it necessary to have both PO and Invoice together?
Not necessarily. Analysis can be done from POs only or from AP invoices only. However, the best results appear when line-level details (Vendor + Amount + Date + Item/Description) are available.
Does it support multi-entity/branch companies?
Yes, if you provide Company/Branch/Cost center in the import data. Reports will be generated by entity and then a total Consolidated report.
How are suppliers standardized practically?
Through the Vendor normalization table: Vendor code/name → Standard vendor. Any merge case is recorded as a decision (Merge) and any uncertain case remains as Exceptions until resolved.
Does it support spend analysis by item at the Sub-category level?
Yes, through Category/Sub-category mapping. It is important to have an item dictionary/description or Item/GL to assist with classification.
Does purchase price variance appear without quantities (Qty)?
Variance can be revealed at the “average price” level if the data contains Unit price. If Qty/Unit price is not available, the analysis will appear at the Amount level only, not as Unit price variance.
Can it be used to monitor procurement spending monthly?
Yes. The template is designed to produce a monthly Pack: spend trend + top suppliers + exceptions + unclassified items needing decision.
Does it produce automatic “savings” or negotiation recommendations?
No general promises are made. What it produces are evidences: price variances, spending concentration, tail spend, and similar suppliers—these are used to create a documented negotiation decision.
Is there a delivery template for internal review?
Yes: Evidence index + Sign-off + Exceptions/Mapping logs within a specified period Pack.
Ready to Adopt a Traceable Spend Baseline Instead of “Aggregate” Reports?
Outputs: Spend Cube + Purchase analysis by supplier + Analysis by item + Purchase price variance + Delivery Pack.
| المسمّى الوظيفي | |
|---|---|
| Duration | |
| المستوى | |
| التحديثات | |
| القطاع | |
| الصيغة |
Related products
Reviews
Clear filtersThere are no reviews yet.