


Materials/Labor/OH Variances – Excel Template
63.56 $
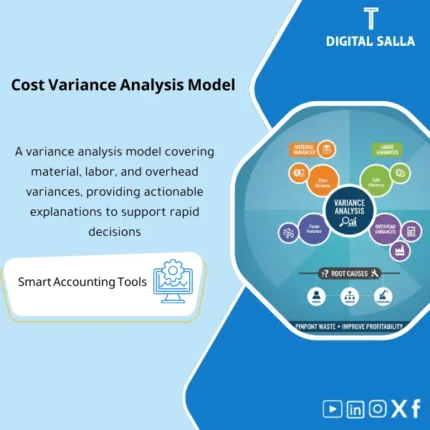
Cost Variance Analysis: Separates material variances (price/usage), labor variances (rate/efficiency), and overhead variances (spend/absorption) by order/product. Delivers root-cause variance reporting for factory and costing teams during monthly review.
Cost Variance Analysis
Variance Analysis Template on Excel for practical and organized analysis of factory variances: Material Price/Usage Variance + Labor Rate/Efficiency Variance + Overhead Variance OH with Root Cause Analysis and the issuance of a Factory Variance Report monthly deliverable within the Closing Pack.
Value Proposition: Instead of vague “manufacturing variances” in the GL, you will receive a template that turns them into a comprehensible story: What changed? (Price/Quantity/Efficiency/Rate/Volume) and why? Who is responsible? What is the corrective action?
In 20 seconds: What will you get?
- Material Variance: Analysis of Material Price/Usage Variance (Purchase Price/Actual Usage vs. Standard).
- Labor Variance: Analysis of Labor Rate/Efficiency Variance (Wage Rate/Operating Hours).
- Overhead Variance: Analysis of Overhead Variance OH (Spending/Efficiency/Volume based on the allocation method).
- Root-Cause Pack: Pages for Root Cause Analysis (5 Whys / Fishbone / Drivers) with fields for action and escalation.
- Factory Variance Report: A ready-to-use template for issuing a Factory Variance Report monthly (Executive Summary + Top Causes + Top 10 SKU/Lines).
- Action Tracker: Tracking of corrective actions (Owner / Due Date / Status / Evidence).
Delivery associated with the button: Material/Labor/OH Variance + Root Cause Pack + Factory Variance Report + Action Tracker.
Suitable for
- Plant/Factory Controller: Needs to quickly read variances and issue a clear monthly report.
- Cost Accountant: Wants a standardized template for Price/Usage and Rate/Efficiency variances and OH.
- Finance Manager / CFO: Wants an executive summary that explains changes in COGS and margin with reasons, not just numbers.
- Operations/Production Manager: Wants “operational reasons” and Action Items, not just accounting.
Not Suitable for
- If there are no Standards (BOM/Routing/Std Rates) or no measurement of Actual quantity/hours—analysis will be limited.
- If you want a complete BI tool with direct database linking—this is an Excel Template, not an enterprise reporting system.
Without the template / With the template
| Item | Without the template | With the template |
|---|---|---|
| Material Variances | “COGS increased” without explanation | Material Price/Usage Variance with cause identification (Price/Waste/Alternative/Mix) |
| Labor Variances | Hours higher than usual without Owner | Labor Rate/Efficiency Variance with efficiency and downtime analysis |
| OH Variances | OH variance accounts “closed” without a story | Overhead Variance OH (Spending/Volume/Efficiency) based on the allocation method |
| Monthly Report | Presentation of numbers only | Factory Variance Report with Executive Summary + Top Drivers + Actions |
Before Use: 5 Symptoms That Your Variance Analysis Is Incomplete
- The margin fluctuates monthly and no one can answer: Is the reason material price? Usage? Operational efficiency? Or OH?
- Variance accounts in the GL accumulate and are “zeroed” at the end of the period without explanation or corrective plan.
- There is no clear separation between Price vs Usage or Rate vs Efficiency.
- Departments blame each other: production says “purchasing is expensive,” and purchasing says “usage is higher,” with no model to separate the impact.
- The monthly factory report consists of numbers without Root Cause Analysis or Owner and actions.
What Does the Variance Analysis Template Cover?
This Variance Analysis Template is designed to be a “layer of interpretation” between ERP data (Standards/Actuals)
and operational and financial management. It breaks down cost variances into actionable Drivers:
Material Price/Usage Variance, Labor Rate/Efficiency Variance, and Overhead Variance OH,
then produces a Factory Variance Report ready for dispatch with an Action Plan.
Implementation Method (3 Steps)
Step 1: Prepare the Data
- Standards: Standard material prices + Standard quantities from BOM + Standard hours from Routing + OH allocation rates.
- Actuals: Purchase/Consumption prices + Actual quantities used + Actual hours + Actual/Budgeted OH.
- Dimensions: Plant/Line/Work Center + SKU/Product + Production Order/Period.
Step 2: Run the Analysis
- Calculate Material Price/Usage Variance for each product/period and identify Top Drivers.
- Calculate Labor Rate/Efficiency Variance and link it to downtime/restart/productivity.
- Calculate OH Variance based on your model (Spending/Volume/Efficiency) and show “Is the issue in spending or production volume?”.
Step 3: Reporting and Follow-Up
- Produce a Factory Variance Report: Executive Summary + Cause Analysis + Recommendations.
- Activate the Action Tracker: Action Owner + Due Date + Status + Closure Evidence.
- Identify what needs to adjust Standard / what requires operational action / what needs data or UOM processing.
Product Components (Clear Inventory)
-
Material Variance Pack (Material Price/Usage Variance)
- Practical Purpose: Separate “price increase” from “increased quantity/waste/mix”.
- When to Use: Monthly during closing or weekly for monitoring sensitive materials.
- Outputs: Price Variance + Usage Variance + Top Materials + Notes.
-
Labor Variance Pack (Labor Rate/Efficiency Variance)
- Practical Purpose: Separate “higher wage rate” from “lower efficiency/more time”.
- When to Use: After salary/allowance changes or when productivity declines.
- Outputs: Rate Variance + Efficiency Variance + Hours Bridge.
-
Overhead Variance Pack (Overhead Variance OH)
- Practical Purpose: Clarify whether the variance is due to higher spending (Spending) or lower production volume (Volume) or efficiency of allocation (Efficiency).
- When to Use: Month-End + when changing Rates/Capacity.
- Outputs: OH Spending/Volume/Efficiency Summary + Drilldown by Cost Pool.
-
Driver & Root-Cause Toolkit (Root Cause Analysis)
- Practical Purpose: Turn numbers into actionable causes (Supplier price, Scrap, Rework, Downtime, Mix change).
- When to Use: During Top Variance or when the same variance recurs for 2–3 months.
- Outputs: 5 Whys + Fishbone + Owner + Corrective Action.
-
Factory Variance Report (Factory Variance Report)
- Practical Purpose: Produce a ready monthly report for management: What are the top 5 variances? What is our plan?
- When to Use: At month-end + performance meeting.
- Outputs: Executive Summary + Top 10 SKUs/Lines + Actions + Status.
-
Action Tracker (Action Tracking)
- Practical Purpose: Prevent the same variance from recurring without closing the root cause.
- When to Use: Weekly/Monthly based on performance governance.
- Outputs: Action Log + Evidence Links + Closure Notes.
What Should Be Included in the Delivery?
- Clear Tabs: Inputs / Standards / Actuals / Material Variance / Labor Variance / OH Variance / Drivers / Report / Actions.
- Input Rules (Validation): Prevent illogical negative values, incompatible UOM, hours without a work center, OH without a cost pool.
- Executive Summary: 1 page summarizing “Why did unit cost and margin change?” with the top 3 drivers.
- Traceability: Each variance number is drillable to SKU/Order/Line and period.
After Implementation (Only Two Points)
- Operational Outcome: You will know the “source of variance” precisely: Price/Usage/Efficiency/Rate/OH—leading to faster decisions (adjusting supplier/improving waste/increasing efficiency/modifying production plan).
- Control Outcome: Variances will shift from “vague” accounts to a documented Factory Variance Report with Root Cause Analysis and Action Tracker.
FAQ — Questions Before Purchase
Does the template require Standard Cost to work?
It is highly recommended to have Standards (BOM/Routing/Std Rates). Without them, you can make a comparison of “Budget vs Actual,” but the quality of Price/Usage and Rate/Efficiency will be lower.
Does it cover material variances for purchasing only or for production as well?
It covers both based on your data: Price Variance from purchasing/invoices, and Usage Variance from material consumption/usage against the standard.
How do I analyze Overhead Variance?
The template supports analysis of Overhead Variance OH into Spending/Volume/Efficiency provided the allocation method (Hours/Units) and rates/budget are specified.
Can I generate the report at the Plant/Line/Work Center level?
Yes—by adding dimensions (Plant/Line/Work Center) in the input data and then filtering the report; the ultimate goal is a Factory Variance Report as needed by management.
Is there a section for “Root Cause Analysis” or just numbers?
There is a Root-Cause Toolkit: Drivers + 5 Whys + Fishbone + Actions, because the goal is not just to present numbers but to close the cause.
Is it suitable for Month-End Close?
Yes—it is designed to be included in the Closing Pack: Variance Summary + Top Causes + Corrective Actions.
If you want to interpret factory variances instead of “zeroing” them at month-end
Outputs: Variance Summary + Driver Analysis + Root Cause + Factory Variance Report + Action Tracker.
| المسمّى الوظيفي | |
|---|---|
| Duration | |
| المستوى | |
| التحديثات | |
| القطاع | |
| الصيغة |
Related products


Reviews
Clear filtersThere are no reviews yet.