


Scrap & Yield Tracker – Excel Template
55.59 $
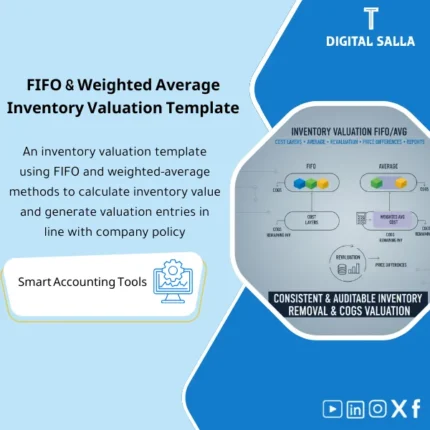
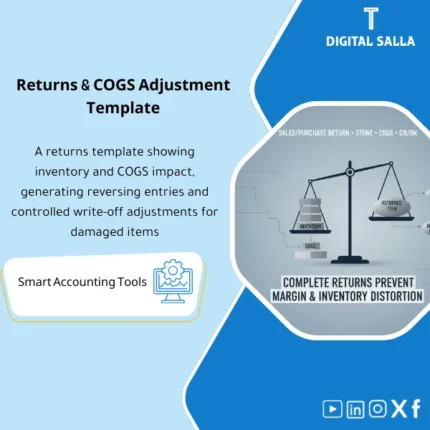
Scrap & Yield Template: Tracks scrap and yield rates by product/line/shift with quality causes and linkage to waste cost. Delivers scrap reporting and yield trend analysis for production and costing improvement.
Scrap/Yield Tracker Template
A practical template (Excel/Tracker Pack) for tracking Production Scrap and Yield Ratios along with Quality Indicators, including Root Cause Analysis (Pareto/Trends), financial impact measurement, and linking results to production orders and inventory.
Value Proposition: Instead of “defects” and “scrap” being just vague numbers or impressions, this template provides you with a single file that demonstrates: Where is the scrap occurring? Why? How much is it costing us? And how can we reduce it? at the level of (Order/Line/Shift/SKU/Reason).
In 20 seconds: What will you get?
- Scrap Tracker: Detailed scrap record by production order/line/shift/product/scrap reason.
- Yield Tracker: Calculation of Yield and Scrap Rate and FPY (First Pass Yield) by period, product, and line.
- Cost of Scrap: Translating scrap into financial impact (Materials/Time/Unit Cost/Standard/Actual Cost).
- Quality KPIs: Process quality indicators: Defect Rate, Rework Rate, Rejects, Top Defects.
- Pareto + Trends: 80/20 analysis of scrap causes and trends (monthly/weekly/by shift).
- Action & RCA Log: Record of corrective actions (CAPA) with responsible person, due date, and status.
- Audit-Friendly: Traceability: Every scrap number linked to a source (record/evidence/production order/destruction report/return).
Delivery associated with the button: Scrap Tracker + Yield KPIs + Cost Impact + Pareto + Action Log.
Suitable for
- Factory/Production Line: Needs to reduce scrap and improve yield while identifying major causes of defects.
- Quality Team: Wants a KPI dashboard + Pareto + CAPA tracking.
- Costing/Finance: Wants to translate defects into cost figures (scrap cost) and link them to waste/damaged goods and COGS.
- Operations Manager: Wants to compare shifts/lines and identify issues immediately.
Not Suitable for
- If there is no clear definition of “Good vs Scrap vs Rework” or if scrap reasons are not recorded—results will be incomplete.
- If you want a real-time system connected to machines (MES/OEE) — this is a reporting and control template, not direct industrial integration.
Without the template / With the template
| Item | Without the template | With the template |
|---|---|---|
| Understanding Scrap Volume | “We feel it” or a total number without detail | Scrap Qty/Rate by (Line/Shift/Order/SKU/Reason) |
| Measuring Yield | No unified KPI or calculated in different ways | Yield% + FPY% + Trends with fixed definitions |
| Cause Analysis | List of causes that are unclear or without Pareto | Automatic Pareto + Top 5 Reasons + Heatmap by shift/line |
| Financial Impact | Scrap does not show its true impact on profitability | Scrap Cost (Materials/Time/Cost) + Linking to waste/Write-off |
Before Use: 5 Symptoms That You Need a Scrap/Yield Tracker
- Production costs are increasing or margins are decreasing without clear explanation.
- Recurring “Quality Issues” but no clear Pareto of the major causes.
- Significant differences between shifts/production lines with no unified comparison.
- Waste/damaged goods in inventory appear as accounting numbers, but there is no operational link to production causes.
- No record of actions (CAPA) linked to scrap data—leading to the same problem recurring every month.
What Does the Scrap & Yield Template Cover?
It covers three layers: Recording → Calculating → Analyzing and Taking Action.
The goal is not just to “collect data,” but to transform it into actionable decisions.
Basic KPI Definitions (modifiable)
- Input Qty: Quantity input for the production process (Materials/Units before inspection).
- Good Qty: Quantity that is sound and acceptable (Passed QC / Accepted Output).
- Scrap Qty: Quantity that is rejected and not repairable (Reject/Discard).
- Rework Qty: Quantity that needs reprocessing/correction (not treated as Scrap unless it fails).
- Yield %: Good Qty ÷ Input Qty
- Scrap Rate %: Scrap Qty ÷ Input Qty
- FPY % (optional): Good Qty (from the first time) ÷ Input Qty
Implementation Method (4 Steps)
Step 1: Set Up Reason Codes Dictionary
- Standard list of causes (Machine, Material, Man, Method, Measurement, Environment).
- Classify the cause: Quality/Operation/Supplier/Machine Setup… etc.
Step 2: Enter/Import Daily Scrap Record
- At the level of (Order/SKU/Line/Shift/Date).
- For each scrap incident: Scrap Qty + Reason + Comment + Responsible Person.
Step 3: Automatically Calculate Yield and Scrap Cost
- Calculate KPI by day/week/month.
- Calculate financial impact: Scrap Qty × (Cost per Unit) or × Standard/Actual Cost.
Step 4: Analysis and Actions
- Pareto of scrap causes + Trend lines + Shift/Line comparison.
- Open CAPA actions for the top causes and set Target Reduction and track progress.
Product Components (Clear Inventory)
-
Scrap Log
- Fields: Date | Plant/Line | Shift | Order | SKU | Input | Good | Scrap | Rework | Reason Code | Comment | Reporter | Approver.
- Key Feature: Standardizing definitions of Good/Scrap/Rework to avoid reporting discrepancies.
-
Reason Codes Dictionary
- Fields: Reason Code | Category | Subcategory | 6M Bucket | Owner Team | Corrective Standard.
- Purpose: Ensure that the “reason” is analyzable and not a random description.
-
Yield & Scrap KPIs
- Outputs: Yield% | Scrap Rate% | FPY% | Rework Rate% | Defect PPM (optional).
- By: SKU/Order/Line/Shift/Month.
-
Cost of Scrap
- Inputs: Cost per Unit (Standard/Actual) or Material+Labor Rate.
- Outputs: Scrap Cost by Reason/SKU/Line + Top Cost Drivers.
-
Pareto & Trend Dashboard
- Pareto: Top Reasons (Qty/Cost) + Contribution percentage of each reason.
- Trend: Yield and Scrap Rate trends over time + Shift comparison.
-
CAPA / Action Tracker
- Fields: Issue | Root Cause | Action | Owner | Due Date | Status | Verification | Impact (Before/After).
- Purpose: Transform analysis into actual improvements, not just a report.
-
Exceptions & Controls
- Alerts: Orders without Input/Good, Scrap above standard threshold, Unclassified reasons, Sudden shifts deterioration.
- Data Protection: Prevent entry of unreasonable quantities + Automatic verification.
What Should Be Included in the Delivery?
- Suggested Tabs: Data | Reason Codes | KPIs | Scrap Cost | Pareto | Trends | CAPA | Controls.
- Shift/Line Comparison: Pivot-ready to measure where the issue lies (Shift A vs B) and (Line 1 vs 2).
- Optional Accounting Link: Export Summary for recording/interpreting write-off entries or production cost variances.
After Implementation (Just Two Points)
- Operational Outcome: You will have a clear “scrap map” (where/when/why) targeting the highest cause instead of randomly distributing efforts.
- Financial Outcome: Quality issues turn into cost figures—linking yield improvement directly to margin enhancement.
FAQ — Questions Before Purchase
What is the difference between Scrap and Rework?
Scrap is definitively rejected and not repairable, while Rework requires reprocessing and may return to “Good”.
The template distinguishes between the two to prevent inflation of the scrap ratio or mixing quality indicators.
How do we calculate Cost of Scrap if we don’t have accurate actual costs?
You can start with Standard Cost or average cost (Materials + Labor) as an approximate value.
The important thing is to establish a uniform methodology for comparison over time, then improve it later when actual data is available.
Does it support tracking scrap by machine/supplier/material batch?
Yes, provided the fields are available in your data. The template is designed to accept additional dimensions such as Machine ID, Vendor, Lot/Batch.
Can it be linked to production orders and material issue files?
Yes. The Scrap Log can be linked to the production order number and SKU, making it easier to connect the impact to costs and WIP/COGS.
How do we ensure data quality and avoid “beautifying the numbers”?
By adding controls: Approved reasons only, approvals, maximum/minimum limits, and exceptions that appear directly in the dashboard.
The template includes a Controls tab for this purpose.
Does it replace a Quality/MES system?
No—it is a practical quick alternative when there is no MES or when you need a rapid control/reporting template.
It can also be used as a reporting layer over MES/ERP.
If you want to reduce scrap and improve Yield “with numbers” along with cause analysis and financial impact
Outputs: Scrap Log + Yield KPIs + Scrap Cost + Pareto + Trends + CAPA.
| المسمّى الوظيفي | |
|---|---|
| Duration | |
| المستوى | |
| التحديثات | |
| القطاع | |
Related products


Reviews
Clear filtersThere are no reviews yet.