


Break-even & Sensitivity Model – Excel File
63.56 $
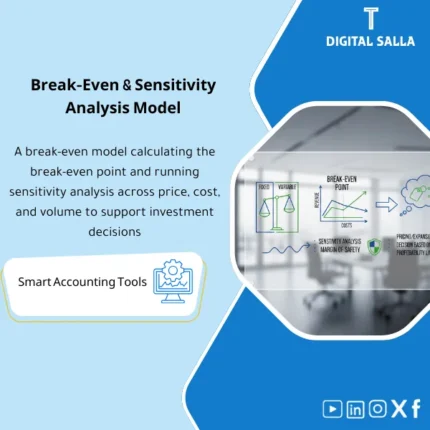
Break-Even Model: Calculates break-even point, margin of safety, and sensitivity to price/volume and fixed/variable cost changes. Delivers profitability scenarios to support pricing and expansion decisions.
Break-even Model
Subline: Break-even + Margin of Safety + Sensitivity (Price/Volume/Cost) + Scenario Table + Decision Notes
Value Proposition: A model that demonstrates “Where is the break-even point?” and “What is the margin of safety?” and “What breaks profitability?”: Price + Volume + Variable Cost + Fixed Cost → Break-even → Margin of Safety → Sensitivity (±) → Scenarios → Action Notes instead of discussing profitability without reviewable sensitivity numbers.
In 20 Seconds: What Will You Get?
- Break-even Units: The number of units/orders required to cover fixed costs.
- Break-even Revenue: Break-even revenue (based on current price).
- Contribution Margin: Contribution margin (value and percentage) linked to variable cost.
- Margin of Safety: Margin of safety (in units/revenue/percentage) compared to expected volume.
- Sensitivity Grid: The impact of ± changes in price/volume/variable/fixed cost on profit and break-even.
- Scenario Table: Best/Base/Worst with clear outputs (Profit/BE/MOS).
- Decision Notes: Decision points: “What needs to change” to reach a specific profit target.
CTA related to outputs: Receive Break-even + MOS + Sensitivity to evaluate any price/volume/cost decision with clear numbers.
Suitable For
- FP&A for profitability sensitivity analysis before pricing or expansion decisions.
- Financial Controller to determine volume/price requirements to achieve profit targets.
- Owner/GM to quickly understand “What breaks profitability” (MOS + scenarios).
Not Suitable For
- Multi-product activity without the ability to define mix or average contribution margin (can be run but needs simplification/weighting).
- Those seeking a comprehensive financial model (P&L/BS/CF) — this is a break-even and sensitivity decision model.
Without the Model / With the Model (Quick Comparison)
| Item | Without the Model | With the Model |
|---|---|---|
| Break-even | General estimate without clear units/revenue | BE units + BE revenue + contribution margin |
| Sensitivity | Discussion “If we increase the price” without numerical impact | Sensitivity grid: Impact of price/volume/cost |
| Margin of Safety | Unknown: Are we close to break-even? | MOS% shows the distance before loss |
Before Use: 5 Symptoms
- Decision to reduce price without knowing its effect on break-even.
- Increased fixed costs (rent/salaries) without measuring additional volume required.
- Discrepancy in estimating variable costs among different teams.
- Lack of scenarios (Best/Worst) when making expansion decisions.
- No clear margin of safety before falling into loss.
Application Method (3 Steps)
Step 1: Input Entries
- Price, expected volume, variable cost/unit, fixed costs.
- Define the measurement basis: Unit/Order/Service Hour.
Step 2: Calculate Break-even and MOS
- Calculate contribution margin and BE units/revenue.
- Calculate Margin of Safety compared to expected volume.
Step 3: Sensitivity and Scenarios
- Run sensitivity on price/volume/cost.
- Output scenarios (Base/Best/Worst) and document decision.
Product Components
- Inputs Sheet — Price/Volume/Variable/Fixed + Unit Definition.
- Break-even Output — BE units/revenue + contribution margin.
- Margin of Safety — MOS units/value/%.
- Sensitivity Grid — Impact of ± changes on profit and BE.
- Scenario Table — Best/Base/Worst + Decision Summary.
- Sign-off — Reference copy for the scenario used.
Delivery Contents
- Inputs + Unit Definition.
- Break-even + MOS.
- Sensitivity + Scenarios.
- Version/Sign-off.
After Application
- Operationally: Pricing/cost decisions based on required units rather than impression.
- Managerially: Visibility of margin of safety and determining when to raise price/lower cost/increase volume.
FAQ
Is it suitable for services rather than products?
Yes, if you consider the “unit” as an hour/project/order, and define the associated variable cost.
Does it support more than one product?
It can through average contribution margin or mix, but requires defining the mix distribution (weight of each product).
Can it be linked to the budget?
Yes, by using volume/price from the budget as the Base scenario and then measuring sensitivity around it.
Does it provide automatic recommendations?
It shows the impact of change on BE/MOS, and the recommendation is documented in Decision notes based on your goal.
Ready to Measure Profitability Before the Decision?
| المسمّى الوظيفي | |
|---|---|
| Duration | |
| المستوى | |
| التحديثات | |
| القطاع | |
| الصيغة |
Related products

Customer Contracts Register – Excel Template
Customer Contract Management Template is a comprehensive Excel-based program to manage customer contracts effectively, including contract data, payments tracking, completion percentages, delivery dates, and project profitability—supported by automated reports that improve contract oversight and customer relationships.


Reviews
Clear filtersThere are no reviews yet.