


Digital Accounting Skills Guide: Excel/Power Query/Power BI – PDF File
63.56 $
Excel Course for Accountants: Covers advanced Excel, Power Query (data cleansing and consolidation), and Power BI to build KPI dashboards and management reporting. Delivers a structured learning path and practical exercises for refreshable reporting without copy/paste.
Digital Accountant Skills Guide
Advanced Excel + Power Query + Power BI for Accountants | Report Automation + Financial Dashboards + Practical Use Cases
Value Proposition: A practical guide that elevates the digital accountant’s efficiency from “manual sheets” to an automated reporting system: Excel Advanced → Power Query (ETL) → Model/Data → Power BI Dashboards → Refresh & Governance with applicable accounting use cases.
In 20 Seconds: What Will You Get?
- Advanced Excel for Accountants: Professional formulas, Pivot, Power Pivot, financial models.
- Power Query (ETL): Automatically import/clean/merge GL/AR/AP data.
- Accounting Data Modeling: Simple star schema for TB and P&L.
- Power BI for Finance: Dashboards (P&L, Aging, Cash, KPIs).
- Update Automation: Refresh closing steps instead of rework.
- Real Use Cases: Month-End, Recs, Compliance KPIs.
- Governance and Performance: Naming, Versioning, Performance tips.
CTA related to outputs: Receive Templates + Dashboards + Queries that reduce manual work and accelerate reporting.
Suitable For
- Accountants/Senior looking to automate reports instead of repetitive sheets.
- Financial Controller for building quickly updated management dashboards.
- FP&A Teams for linking and visually analyzing data.
Not Suitable For
- Complete beginners in Excel (basics are required first).
- Those looking for a video course only without practical application.
Without the Guide / With the Guide (Quick Comparison)
| Item | Without the Guide | With the Guide |
|---|---|---|
| Update | Manual copy/paste | Automatic Refresh via Query |
| Quality | Human errors | Cleaning and validation rules |
| Presentation | Long tables | Financial Dashboards |
Before Use: 5 Symptoms
- Manually recreating the same reports every month.
- Difficulty merging multiple files (GL/AR/AP).
- Closing delays due to report preparation.
- Poor presentation to management.
- Files without Versioning.
Application Method (3 Steps)
Step 1: Advanced Excel
- Formulas, Pivot/Power Pivot, accounting models.
- Organizing sheets and Performance.
Step 2: Power Query
- ETL for accounting data (cleaning/merging).
- Setting up a fixed Refresh for closing.
Step 3: Power BI
- Simple modeling + Measures.
- Financial Dashboards and periodic updates.
Guide Components
- Excel Advanced — Formulas, Pivot, Models.
- Power Query — Import/Clean/Merge.
- Data Modeling — Basics for accountants.
- Power BI — Financial Dashboards.
- Automation — Refresh & Governance.
Delivery Contents
- Excel/Query/BI files.
- Ready Dashboards.
- Accounting use cases.
- Governance guidelines.
After Application
- Operationally: Faster reports with fewer errors.
- Professionally: Upgraded digital skills for accountants.
FAQ
Does it require prior experience with Power BI?
No, it starts from the basics suitable for accountants.
Are the examples actual accounting cases?
Yes (P&L, Aging, Cash, KPIs).
Can it be used within the company?
Yes for internal development and building custom dashboards.
Ready to take accounting to a digital level?
| المسمّى الوظيفي | |
|---|---|
| Duration | |
| المستوى | |
| التحديثات | |
| القطاع | |
| الصيغة |
Related products
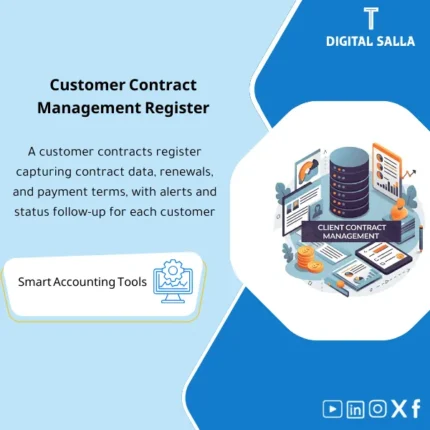
Customer Contracts Register – Excel Template
Customer Contract Management Template is a comprehensive Excel-based program to manage customer contracts effectively, including contract data, payments tracking, completion percentages, delivery dates, and project profitability—supported by automated reports that improve contract oversight and customer relationships.


Reviews
Clear filtersThere are no reviews yet.