


Management Accounting: How to Support Decision Making and Achieve Objectives

Management Accounting: How to Support Decision Making and Achieve Objectives
Management accounting isn’t just about “recording what happened,” but rather asking “What if…?” It transforms numbers into decisions: pricing, planning, budgeting, control, and margin improvement. In this guide, you will learn the difference between it and financial accounting, its key tools (CVP, Budgets, Variance Analysis, KPIs), featuring a Break-Even Calculator ready to use within the page.
- A clear understanding of the role of Management Accounting in supporting management rather than just external reporting.
- A practical way to read costs: Cost Behavior + Contribution Margin + Break-Even Point.
- How to build a trackable Budget and use Variance Analysis to find the root cause.
- How to design a KPI Dashboard that links operations to profitability, not just “vanity metrics.”
- Start Here: Cost Accounting (Definitions and Costing Systems).
- Compare with: Financial Accounting Basics (Understanding the difference).
1) What is Management Accounting? Why is it Different?
Management Accounting is an information system with a primary goal of serving management: transforming operational and cost data into analysis and then a decision. Unlike Financial Accounting, which focuses on external reports and compliance with presentation standards, Management Accounting is flexible because its real customer is “Management.”
| Dimension | Management Accounting | Financial Accounting |
|---|---|---|
| Goal | Decision support & Profit improvement | Reporting results & Solvency to external parties |
| Audience | Management (Internal) | Investors/Lenders/Regulators (External) |
| Period | Daily/Weekly/Monthly (Operational) | Quarterly/Annually (Historical) |
| Detail | High (Product/Channel/Branch/Client) | Aggregated/Summarized |
| Flexibility | Flexible based on decision needs | Restricted by reporting standards (IFRS/GAAP) |
2) Outputs: Internal Reports that Drive Decisions
The value of Management Accounting is not in the number of reports, but in the fact that each report answers a specific managerial question. Examples of practical outputs:
- Product/Service Profitability (Contribution / Gross Margin) by channel or branch.
- Cost Analysis: Fixed/Variable/Mixed + Cost Drivers.
- Budgets (Operational and Capital) linked to objectives.
- Variances (Price/Quantity/Efficiency) to identify the cause, not just the “result.”
- KPIs (Operational and Financial) in a single dashboard.
- Accounting Software for Financial Analysis (Tools for reporting).
- Financial Impact of Strategic Decisions (Scenario planning).
3) CVP Analysis: Contribution Margin & Break-Even
One of the most powerful tools in Management Accounting is Cost-Volume-Profit (CVP) Analysis. The idea is simple: Decisions rely on knowing what happens to profit when Price, Volume, or Cost changes.
3.1 Key Concepts
- Variable Cost per Unit: Increases with every unit sold.
- Fixed Cost: Does not change (relatively) within a specific capacity range.
- Contribution Margin per Unit = Selling Price − Variable Cost per Unit.
- Break-Even Point (Units) = Fixed Costs ÷ Contribution Margin per Unit.
3.2 Quick Example (Pricing Decision)
If the unit price is 200 and variable cost is 120, the Contribution Margin = 80. If Fixed Costs are 160,000 → Break-Even = 2,000 units. Any sales above 2,000 units begin to generate profit (before other items).
4) Budgets & Planning: From Master Budget to Rolling Forecast
Management Accounting holds the “steering wheel” between the goal and reality. A budget is not just a large Excel file; it is a management system: Goal → Resource Plan → Monitoring → Course Correction.
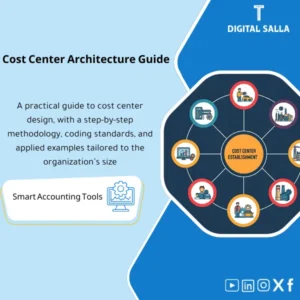
Cost Centers Guide - Practical Steps & Templates
How to Design the Right Cost Center Structure: A practical guide for building an effective cost cent...
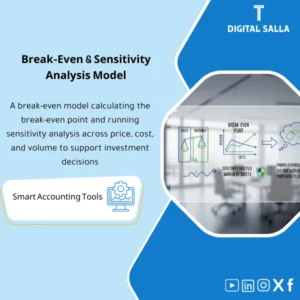
Break-even & Sensitivity Model - Excel File
Break-Even Model: Calculates break-even point, margin of safety, and sensitivity to price/volume and...
| Type | When Used? | Expected Outputs |
|---|---|---|
| Master Budget | Comprehensive Annual Planning | Sales/Production/Expenses/Cash Flow/Profitability |
| Operating Budget | Monthly Operational Management | Operational indicators + Cost + Margin |
| Capital Budget | Investment Decisions (Equipment/Expansion) | Feasibility, Priority, Cash & Profit Impact |
| Rolling Forecast | Volatile Environments (Demand/Prices) | Forecasts updated continuously instead of waiting for year-end |
5) Variance Analysis: Explaining Plan vs. Reality
A variance isn’t necessarily a “mistake”—it’s a signal. The key is to deconstruct it: Is the variance due to Price? Or Quantity? Or Efficiency?
5.1 Simple Deconstruction Example
- Sales Variance: Price higher/lower than planned? Volume higher/lower?
- Variable Cost Variance: Raw material purchase price? Waste? Labor productivity?
- Fixed Expense Variance: Additional items or timing of spending?
6) Short-Term Decisions: Pricing/Special Orders/Make vs. Buy
Here, Management Accounting shines brightest: rapid decisions requiring “Relevant Cost” rather than all historical accounting costs.
6.1 Special Order
If a client asks for a quantity at a lower price, the question isn’t “Is the price lower than usual?” But rather: Does the price cover the Variable Cost and add a contribution to cover fixed costs? (Provided it doesn’t affect your primary sales).
6.2 Make vs. Buy
The correct decision depends on: Internal Variable Cost + Avoidable Fixed Costs + Capacity/Quality/Risk impact. Many companies err by calculating “average cost” instead of “avoidable cost.”
7) KPIs and Management Dashboards
Any KPI without a clear financial link turns into a “tracking number” that doesn’t improve profitability. It’s best to build a balanced dashboard: Demand + Operations + Cost + Cash.
| KPI | What does it measure? | Potential Decision |
|---|---|---|
| Gross Margin % | Quality of Pricing/Materials/Ops | Raise price/Change supplier/Reduce waste |
| Contribution Margin | Product contribution to fixed costs | Drop weak product or re-price |
| Inventory Turns | Inventory management efficiency | Reduce obsolete stock/Improve purchasing |
| Cash Conversion Cycle | Speed of converting ops to cash | Improve collection/Supplier terms |
| Unit Cost Trend | Direction of unit cost over time | Process adjustment/Training/Automation |
8) Calculator: Break-Even & Contribution Margin
Enter your product/service data to instantly get: Contribution Margin, Break-Even Point, and required sales to achieve a target profit. The calculator works within the page without external files.
9) Frequently Asked Questions
What is the difference between Management and Financial Accounting?
Management Accounting is internal, focusing on decisions, planning, and control. Financial Accounting focuses on external reporting and presenting performance according to regulations and disclosure standards.
What is Contribution Margin? Why is it important?
Contribution Margin = Selling Price − Variable Cost. It shows how much each unit contributes to covering fixed costs and then generating profit. It is the basis for pricing and special order decisions.
How do I calculate Break-Even?
Break-Even (Units) = Fixed Costs ÷ Contribution Margin per Unit. Break-Even (Sales) = Break-Even (Units) × Selling Price.
Does a budget “restrict” management?
A correct budget does not restrict, it organizes: Clear Goal + Resources + Monitoring + Correction. In volatile environments, it is better to use a Rolling Forecast alongside the annual budget.
What is the most common mistake in Variance Analysis?
Focusing on the “Total Difference” without deconstructing the cause (Price/Quantity/Efficiency), or assigning responsibility for the variance to the wrong owner.
10) Conclusion & 10-Day Action Plan
Management Accounting is a decision management system: Understand cost, build a plan, monitor execution, then improve profitability. Start with one tool (CVP) + one report (Simple Budget) + one KPI dashboard, and you will see a direct impact on decision making.
- Day 1: Classify costs (Fixed/Variable/Mixed) and identify cost drivers.
- Day 2: Calculate Contribution Margin for each product/service/channel.
- Day 3: Apply CVP and identify the Break-Even Point and the biggest “lever” to improve it.
- Day 4: Create a simple monthly budget (Sales/Variable Cost/Fixed/Cash).
- Day 5: Select only 5 KPIs that link operations to profit.
- Day 6: Start weekly monitoring: Plan vs. Reality.
- Day 7: Perform variance analysis (Price/Quantity/Efficiency) for one product.
- Day 8: Review Pricing/Discounts based on Contribution Margin, not just Sales volume.
- Day 9: Identify one improvement decision (Cut variable/Cut fixed/Raise price) and test with scenarios.
- Day 10: Document a monthly policy: Budget → Monitor → Variances → Corrective Action.