


Valuation with Market Multiples (Comparable Multiples): When to use P/E and when EV/EBITDA?
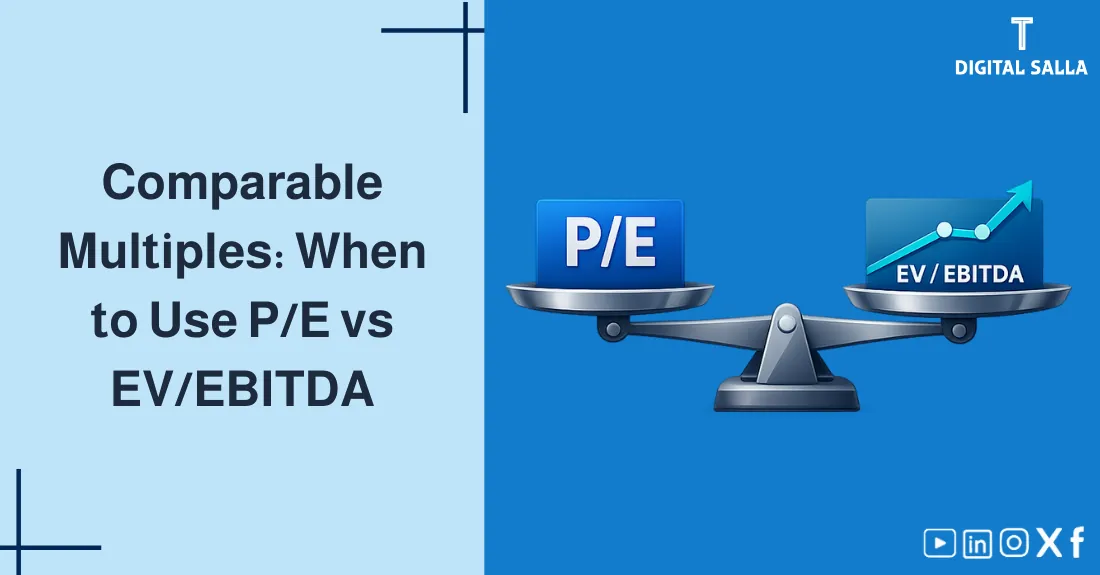
Valuation with Market Multiples (Comparable Multiples): When to use P/E and when EV/EBITDA?
How do you know if a stock is cheap or expensive? The answer is “Relative Valuation.” Instead of building complex DCF models, we compare the company to similar peers using multiples. In this guide, we demystify the most popular market multiples: Why is EV/EBITDA the favorite for mergers and acquisitions? When does the P/E Ratio mislead investors? And how do you perform a professional Comparable Company Analysis (Comps)?
- Concept of Relative Valuation and selecting the “Peer Group.”
- P/E Ratio: Definition, formula, and the trap of different debt levels.
- EV/EBITDA: Why is it the “King of Multiples” for operational comparison?
- Visual model (SVG) explaining Enterprise Value vs. Equity Value.
- Other multiples: P/S (Price-to-Sales) and P/B (Price-to-Book).
- Interactive Tool: Calculate and compare company valuation against industry average.
- Common mistakes in choosing peers (Size, Geography, Growth).
1) What is Market Multiples Valuation?
It is a method of estimating the value of an asset by comparing it to the market values of similar assets. The logic is simple: If similar companies trade at 10 times their earnings, my company (with similar earnings) should also be worth 10x earnings.
2) P/E Ratio: The Investor’s Favorite
Formula: Share Price / Earnings Per Share (EPS).
- Pros: Simple, widely available, directly relates price to shareholder profit.
- Cons: Affected by capital structure (Debt). A company with high debt might have a misleadingly low P/E due to high interest risk.
3) Enterprise Value (EV) vs. Equity Value
- Equity Value (Market Cap): The value of shares only (Price × Shares). This is what you pay to buy the *shares*.
- Enterprise Value (EV): The value of the entire firm (Equity + Debt – Cash). This is what you pay to *acquire* the entire business (takeover).
4) Visual Logic: The EV Bridge
5) EV/EBITDA: The M&A Standard
This ratio compares the total value of the firm (EV) to its operating cash flow proxy (EBITDA). It is “Capital Structure Neutral,” meaning you can compare a company with 0% debt to one with 50% debt fairly.
6) Comparison Table
| Metric | P/E Ratio | EV/EBITDA |
|---|---|---|
| Numerator | Share Price | Enterprise Value (EV) |
| Denominator | Net Income (EPS) | EBITDA |
| Impact of Debt | Distorted by Interest | Neutral (Ignores Interest) |
| Best for… | Retail Investors (Banks/Finance) | Acquisitions, Asset-heavy industries |
7) Interactive Valuation Tool
Estimate a company’s implied share price based on peer multiples:
8) How to Choose the Peer Group?
- Industry: Same sector and business model.
- Geography: Same region (Country risk affects valuation).
- Size & Growth: Similar revenue scale and growth rates.
9) Frequently Asked Questions
Can I use P/E for loss-making companies?
No, because Earnings are negative. In this case, we use EV/Sales (Revenue Multiple) as revenue is usually positive.
What is a trailing vs. forward multiple?
Trailing uses last 12 months’ data (Historical). Forward uses next 12 months’ forecast (Expectation). Forward is generally preferred for valuation.
10) Conclusion
The summary is simple: Market Multiples provide a quick “Reality Check” for valuation. While not as detailed as a DCF model, they tell you what the market is willing to pay *right now*. Mastering the difference between Equity Value (P/E) and Enterprise Value (EV/EBITDA) allows you to compare any two companies fairly, regardless of their debt levels.