


Transport and Logistics Company Accounting: Kilometer cost and fleet depreciation
Transport and Logistics Accounting: Practical Guide to Calculate Cost per Kilometer
Transport and logistics accounting is the science of managing scattered assets: the “product” here is a trip or a delivery, and the success of the business depends on the accuracy of Cost per KM and Fleet Depreciation. Without a specialized system to track fuel and maintenance, profit can vanish on the road. This guide provides the practical framework for logistics costing and financial control—Digital Salla.
- Detailed breakdown of Transport Costs into Fixed and Variable components.
- How to calculate Cost per KM and use it for pricing shipping services.
- Choosing the right Fleet Depreciation method: Straight Line vs. Units of Production.
- Fuel control systems and matching odometers with fuel vouchers.
- Interactive Tool: Cost per Kilometer Calculator.
1) Fixed vs. Variable Costs in Transport (The Core Foundation)
The first step in transport accounting is classifying every expense based on its relationship to the wheels turning.
| Cost Type | Examples | Impact on Accounting |
|---|---|---|
| Fixed Costs | Insurance, Truck Licenses, Base Driver Salaries, Rent | Incurred even if the truck is idle. Increases unit cost when utilization is low. |
| Variable Costs | Fuel, Tires, Repairs, Odometer-based Depreciation | Directly linked to KM. Critical for per-trip profitability analysis. |
2) Transport Cost Breakdown: From Yard to Delivery (SVG)
Understanding how trip costs accumulate is essential for accurate pricing.
3) How to Calculate Cost per KM (The Profit Indicator)
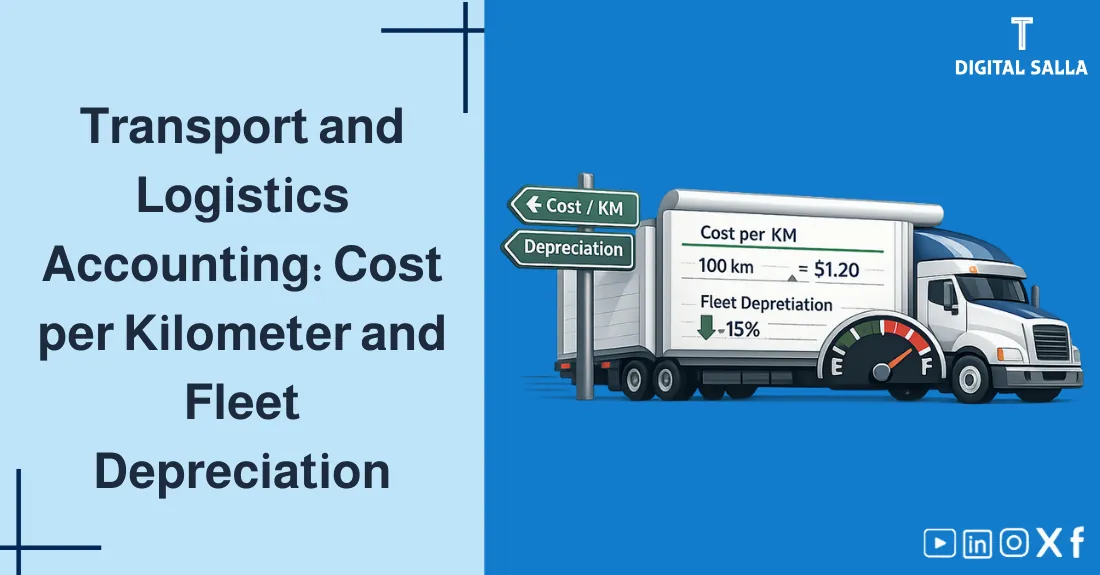
The Cost per KM (CPK) is the most important indicator for a shipping company. It tells you the minimum you must charge per KM just to break even.
Example: If total monthly costs are 50,000 SAR and your fleet drove 20,000 KM, your CPK is 2.50 SAR/KM.

Budgeting & Forecasting Model - Excel File
FP&A & Budgeting Pack: Integrates Budget vs Actual analysis with rolling forecasting, cash forecasti...
4) Fleet Depreciation Methods: Time vs. Usage
Choosing the right method for fleet depreciation is a major accounting decision:
- Straight Line (Time-based): Depreciates the truck over 5-7 years equally. Good for tax compliance but doesn’t reflect actual wear and tear.
- Units of Production (KM-based): Depreciates based on KM driven (e.g., total life 500,000 KM). This matches the expense with the revenue generated per trip.
5) Fuel Control: The Margin Eater
Fuel usually accounts for 30% to 50% of transport costs. Control requires:
- Odometer Integration: Recording KM at every fueling to calculate KM/Liter efficiency.
- Fleet Cards/Vouchers: Avoiding cash payments to drivers to reduce theft risk.
- Route Analysis: Comparing actual fuel used vs. standard fuel for a specific route.
6) Maintenance and Tire Accounting
Repairs and tires are significant variable costs that need proper tracking:
- Preventive vs. Corrective: Tracking the ratio of preventive maintenance can reduce total breakdown costs.
- Tire Lifecycle: Tracking tire cost per KM by recording the Odometer at installation and removal.
- Inventory: Managing on-site spare parts warehouses (filters, oils) to avoid trip delays.
7) Interactive Tool: Cost per KM Calculator
Enter your fleet’s monthly figures to estimate your current operational efficiency.
Calculations update automatically based on your entries.
8) Key Performance Indicators (KPIs) for Logistics
| Indicator | Formula | Accounting Significance |
|---|---|---|
| Empty Mile Ratio | Unloaded KM / Total KM | Measures inefficiency and lost revenue potential. |
| Fuel Efficiency | Total KM / Total Liters | Direct indicator of fleet condition and driver behavior. |
| Revenue per KM | Total Revenue / Total KM | Must be comfortably above CPK to ensure net profit. |
| Maintenance % | Repair Costs / Total Costs | High percentage may signal an aging fleet needing replacement. |
9) Frequently Asked Questions
How is cost per KM calculated in transport?
CPK = Total operating costs (Fixed + Variable) divided by total distance driven.
What is the best depreciation method for trucks?
The “Units of Production” (KM) method is accounting-preferred for accurate matching, while “Straight Line” is simpler for fixed reporting.
How do I control fuel waste?
By using fleet cards, integrating odometers with fuel entries, and analyzing consumption variance per route.
10) Conclusion
Success in transport and logistics accounting requires looking beyond the ledger into the odometer. By mastering Cost per KM, choosing a fleet depreciation method that reflects usage, and strictly monitoring fuel and maintenance, you transform your fleet from an “expense center” into a highly efficient, profitable machine—Digital Salla.