


Variance Analysis: How do you interpret price and quantity differences and operational efficiency?
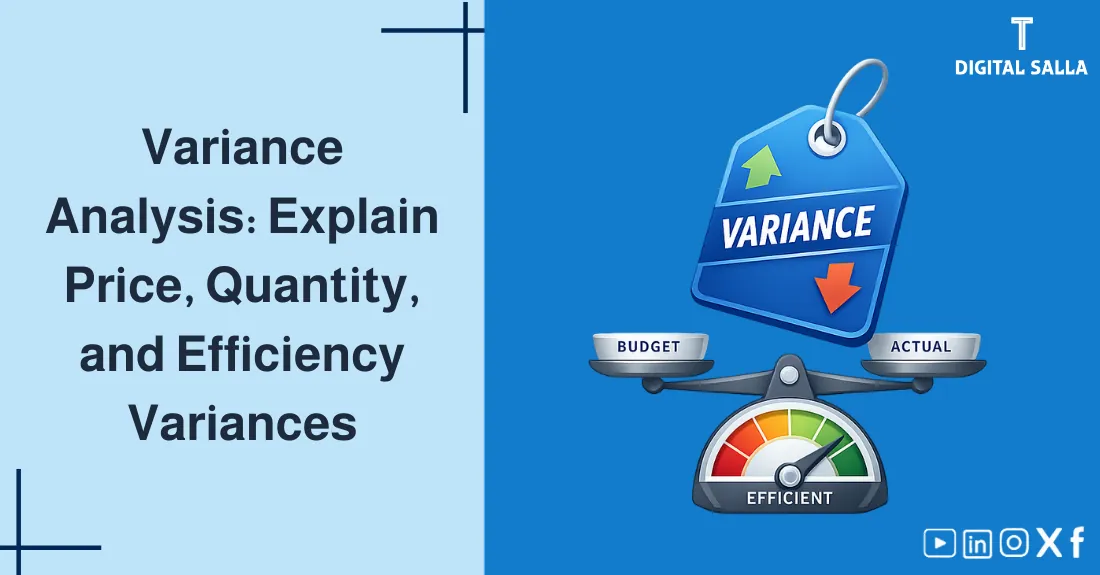
Variance Analysis: How to Interpret Price, Quantity, and Operational Efficiency Gaps?
Variance Analysis: A practical guide on how to interpret material, labor, and sales variances, and link price and quantity differences to operational efficiency through performance reports—Digital Salla.
- What is Variance Analysis and why is it the core of management control?
- In-depth interpretation of Material Variances (Price vs. Quantity).
- Analyzing Labor Variances (Rate vs. Efficiency).
- Analyzing Sales Variances (Price vs. Volume).
- Building Performance Reports and taking corrective actions.
1) The Concept of Variance Analysis
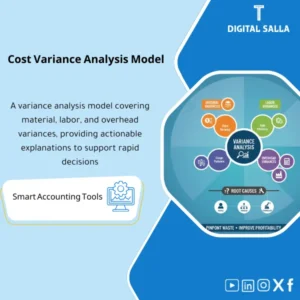
Variance Analysis is the quantitative investigation of the difference between actual results and planned results (Budget or Standards). The goal is not to “Find Blame,” but to Understand Behavior and improve future planning and execution.
2) Splitting Variances: The Price-Quantity Logic
To hold the right people accountable, we must split every total cost variance into two parts:
3) Direct Materials Variance Analysis
This analyzes the difference between what we spent on raw materials and what we should have spent.
- Material Price Variance: (Actual Price − Standard Price) × Actual Quantity Purchased.
- Material Quantity Variance: (Actual Qty Used − Standard Qty Allowed) × Standard Price.
Materials/Labor/OH Variances - Excel Template
4) Direct Labor Variance Analysis
This analyzes the difference between actual wages and hours vs. the standard blueprint.
| Variance Type | Formula | Manager to Call |
|---|---|---|
| Labor Rate Variance | (Act. Rate − Std. Rate) × Act. Hours | HR / Payroll (Did we use overtime?) |
| Labor Efficiency Variance | (Act. Hours − Std. Hours Allowed) × Std. Rate | Production (Why was work slow?) |
5) Sales Revenue Variance Analysis
On the revenue side, variances have a reverse impact: (Actual > Planned) is Favorable.
- Sales Price Variance: (Actual Price − Planned Price) × Actual Units.
- Sales Volume Variance: (Actual Units − Planned Units) × Budgeted Price.
6) Building the Performance Report
A professional Performance Report must consolidate all variances and show their impact on the bottom line.
Example Performance Report Excerpt
- Total Master Budget Profit: $100,000
- Material Price Variance: ($2,000) U
- Material Quantity Variance: $500 F
- Labor Efficiency Variance: ($1,500) U
- Actual Profit: $97,000
7) Management by Exception (Focusing Resources)
In a large company, there are thousands of variances. Managers shouldn’t look at all of them.
- Materiality: Set a threshold (e.g., Investigate only if variance > 10% of standard or > $5,000).
- Controllability: Focus on things the manager can actually change (e.g., Waste) rather than global commodity price shifts.
8) Operational Controls & Readiness Checklist
To ensure your Variance Analysis leads to real improvement:
Variance Control Quality Gate
- Are standard prices updated at least semi-annually?
- Is “Standard Quantity Allowed” based on Actual units produced?
- Do department heads provide written explanations for material variances?
- Are Inventory Valuation impacts (FIFO/WAC) excluded from operational efficiency checks?
- Is there a “Feedback Loop” to adjust standards if they are proven to be unrealistic?
9) Common Errors and How to Prevent Them
- Wait-and-See: Analyzing variances 6 weeks after they happened (data is too cold to act).
- Ignoring Favorable Variances: Assuming they are always good (could mean quality is declining or standards are too low).
- Blaming the Wrong Person: Blaming Production for an unfavorable price variance (which is a Purchasing issue).
- Using Static Budgets: Comparing actuals with a plan made for a different volume level.
10) Frequently Asked Questions
What is Variance Analysis?
It is the process of comparing actual performance with standards to identify and interpret deviations.
What is a “Standard Quantity Allowed”?
It is the amount of material that should have been used to produce the actual units achieved during the period.
Why do we use standard prices in efficiency variances?
To “Freeze” the impact of price changes so we can see the Pure Efficiency of the production team without market noise.
11) Conclusion
Variance Analysis is the engine of “Continuous Improvement.” By separating Price and Quantity differences and focusing on controllable Efficiency, you transform your accounting department into a strategic partner that identifies waste, rewards high performance, and provides senior management with the clarity needed to navigate operational challenges with confidence.
Action Step Now (30 minutes)
- Pick your largest expense variance from last month.
- Split it into Price and Efficiency using the formulas above.
- Find out which specific decision (Purchasing choice vs. Production speed) caused the result.