


Break-even & Sensitivity Model – Excel File
238
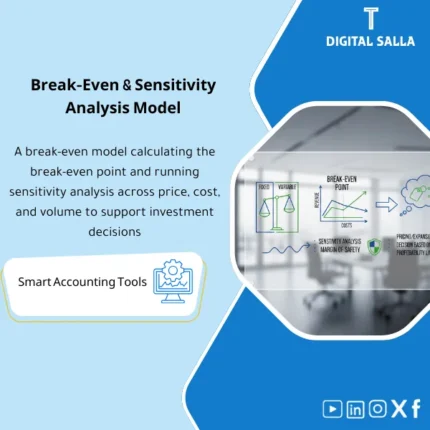
Break-Even Model: Calculates break-even point, margin of safety, and sensitivity to price/volume and fixed/variable cost changes. Delivers profitability scenarios to support pricing and expansion decisions.
Still Guessing When Your Business Will Start Making Money?
This ready-made Excel model gives you 4 integrated sheets (Break-even Analysis + Sensitivity Grid + Scenario Table + Decision Notes) so you can pinpoint your exact break-even point + safety margin + multi-variable sensitivity analysis + Best/Base/Worst scenario planning — all calculated automatically the moment you enter your numbers.
🛡️ 7-Day Guarantee
📊 Editable Excel File
5 Signs You Need This Break-Even Model Right Now
1Blind Pricing Decisions: You set prices based on gut feeling without knowing exactly how many units you need to sell to cover all your costs.
2No Safety Margin Visibility: You have no idea how far your current sales are from the danger zone — or how much revenue you can afford to lose before hitting a loss.
3Single-Scenario Thinking: You plan around one set of numbers without stress-testing what happens in a Best, Base, or Worst case scenario.
4No Sensitivity Awareness: You cannot quickly see what happens to profit if your price drops 5% or your variable costs jump 10%.
5Missing Decision Documentation: You make critical financial calls without a structured Decision Notes section to record your rationale and action items.
What You Get
One fully-built Excel file with 4 interconnected sheets covering break-even, sensitivity, scenarios, and decision documentation.
| Break-even Units & Revenue | Auto-calculated break-even point in both units and revenue so you know the exact sales target to cover all fixed and variable costs. |
| Contribution Margin | Instantly see how much each unit sold contributes toward covering your fixed costs and generating profit. |
| Margin of Safety | Measures the gap between your current sales and the break-even point — so you know exactly how much cushion you have. |
| Sensitivity Grid | A multi-variable grid that shows how changes in price, volume, variable costs, and fixed costs impact your profit. |
| Scenario Table | Pre-built Best/Base/Worst scenarios with auto-calculated Profit, Break-even, and Margin of Safety for each. |
| Decision Notes | A structured section to document your findings, record action items, and align your team on the next financial move. |
How to Use It in 4 Simple Steps
Enter Your Numbers
Fill in your selling price per unit, variable cost per unit, total fixed costs, and current or projected sales volume. All input cells are clearly highlighted.
Read Your Break-Even Results
The model instantly calculates Break-even Units, Break-even Revenue, Contribution Margin, and Margin of Safety — no formulas to write or adjust.
Explore Sensitivity & Scenarios
Adjust any variable (price, volume, costs) and watch the Sensitivity Grid update in real time. Then review Best/Base/Worst outcomes in the Scenario Table.
Document Your Decision
Use the Decision Notes sheet to record your conclusions, recommended actions (launch, adjust pricing, cut costs), and share the file with stakeholders.
Before vs. After Using This Model
| Aspect | ❌ Without | ✅ With This Model |
|---|---|---|
| Break-Even Clarity | Rough guesses with no precise target | Exact Break-even Units + Revenue calculated instantly |
| Risk Awareness | No idea how close you are to a loss | Margin of Safety shows your exact cushion at a glance |
| Variable Testing | No way to quickly test “what if” changes | Sensitivity Grid maps 4 variables against profit in seconds |
| Scenario Planning | One plan with no fallback options | Best/Base/Worst with Profit, BE, and MOS auto-calculated |
You are a business owner, startup founder, financial analyst, or consultant who needs to understand your break-even point, test pricing scenarios, and make data-driven financial decisions — especially if you want a plug-and-play Excel model without building formulas from scratch.
You already use enterprise-level ERP or financial planning software that handles break-even and sensitivity analysis automatically — or you have no need to analyze unit economics, cost structures, or pricing scenarios for your business.
Does this model work for any industry or product type?
Yes. The model is industry-agnostic. You simply enter your own price, variable cost, and fixed costs — the formulas handle everything regardless of your business type.
Can I modify the scenarios and sensitivity variables?
Absolutely. Every input cell is fully editable. You can change any variable (price, volume, costs) and the Sensitivity Grid and Scenario Table will update automatically.
Do I need advanced Excel skills to use this?
Not at all. The file is designed for plug-and-play use. Just enter your numbers in the highlighted input cells and all results, grids, and scenarios populate automatically.
What is the difference between the Sensitivity Grid and the Scenario Table?
The Sensitivity Grid shows how changing one or two variables at a time affects your profit across a range of values. The Scenario Table gives you three complete snapshots (Best/Base/Worst) with all key metrics calculated for each.
Ready to Stop Guessing and Start Knowing Exactly When You Break Even?
One Excel file — five powerful outputs: Break-even + Margin of Safety + Sensitivity + Scenarios + Decision Notes
| الفئات | Management Reports & Financial Analysis |
|---|---|
| Job Title | Finance Manager |
| Level | Advanced |
| Format | Excel |
Reviews
Clear filtersThere are no reviews yet.