


Project Profitability Report – Excel Template
63.56 $
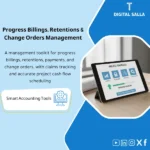
Project Profitability Report: Combines recognized revenue, actual cost, and remaining cost (EAC) to show expected margin and variances by project cost code. Delivers early risk signals for CFOs managing a portfolio and approving corrective actions.
“`html
Project Profitability Report (Project Profitability) — Project Profitability
Subline: An Excel template ready to compile Project Revenues and its costs (actual + committed + forecasted) and produce Project Profit Margin along with EAC (Estimate at Completion) and ETC and variance analysis, in addition to Project Liquidity (collections/payments) to monitor profitability and cash together.
Value Proposition:
Instead of being surprised that “the project turned out to be a loss” after closing… this report gives you an accurate monthly view:
Where did the profit go? (cost/revenue/scope variance) and where is the project heading? (EAC/ETC).
Suitable for contracting/service/internal project environments that require operational financial monitoring, not just accounting entries.
In 20 seconds: What will you get?
- Project P&L: Project revenue versus cost (COGS/Direct) + expenses (if desired) → Gross/Net Margin
- EAC / ETC: Estimated cost at completion + remaining to finish the project (Forecast)
- Actual vs Budget vs Forecast: Comparison of budget/actual/forecast by Cost Codes
- Committed Costs: Committed costs (PO/WO) for reading the “true” profitability before invoices arrive
- Variance Analysis: Project variance analysis (Cost / Revenue / Scope / Productivity)
- Billing & WIP Link: Optional link with invoices/WIP/POC (Under/Over Billing)
- Project Cash View: Project liquidity: collections versus payments + expected balance
- Risks & Alerts: Alerts: negative margin, EAC exceeding contract, high commitments without coverage, delayed collections
- Dashboard: A dashboard summarizing: Margin% / EAC / Remaining Profit / Cash Gap / AR Aging
Delivery associated with the button: Project P&L | EAC/ETC | Cost Codes Analysis | Billing/WIP Link | Cash View | Dashboard.
Suitable for
- Contracting and Projects: Monitoring the margin of each project and linking it to invoices and collections.
- Service/Consulting Companies: Project profitability based on hours/costs/invoices.
- PMO + Finance: Unifying the language of numbers between operations and finance (EAC/ETC/Variance).
Not Suitable for
- If there is no clear definition of the project/Cost Codes or if there are no actual/budget data that can be tracked.
- If the goal is only “accounting entry” without analysis/decisions (here a GL statement is sufficient).
Without the report / With the report
| Item | Without the report | With the report |
|---|---|---|
| Profitability Reading | Shows late or in aggregate | P&L for each project + margin + monthly trend |
| EAC/ETC | Oral forecasts without methodology | Calculated EAC/ETC + variance explanation |
| PO Commitments | Do not appear until invoices arrive | Committed Costs within “true” profitability |
| Collections and Liquidity | A “profitable” project but suffering cash | Cash Gap display + AR Aging + cash forecast |
| Decisions | Reactive after the problem | Early warning + corrective plan (Cost/Scope/Billing) |
Before Use: 5 Symptoms That Your Project Profitability is “Invisible”
- You discover variances too late (after closing a quarter/year).
- The manager sees the project as “completed” while finance sees higher costs without explanation.
- Projects show profits but liquidity is negative due to delayed collections/invoices.
- There is no clear number for EAC, or each department comes up with a different number.
- Supplier commitments (POs) do not appear in profitability assessment until late invoices arrive.
What Does the Project Profitability Report Cover?
1) Project Setup
- Project ID / Client / Project Manager / Sector
- Contract Type: Fixed Price or T&M (setup option)
- Contract Value + Approved Change Orders (optional)
- Start/End Date + Completion Percentage (optional for POC/WIP)
2) Budget by Cost Codes
- Budget by items/Cost Codes: Materials, Labor, Subcontractor, Equipment, Direct Expenses, Other
- Ability to add Phase/Work Package for more precise tracking
- Baseline + Reforecast (optional) to track budget changes
3) Actual Costs
- Upload actual costs from GL/ERP or manual entry from expense report
- Classify cost source: Invoice/Payroll/Expense/Material Issue
- Monthly Analysis: Actual MTD / YTD / LTD
4) Committed Costs
Reading project profitability without commitments is usually misleading.
Therefore, the report includes Committed (Purchase Orders/Subcontractor Contracts) for a more accurate EAC estimation.
- Committed (PO/WO) + Invoiced to Date + Remaining Commitment
- Controls: List of commitments without budget coverage
5) Forecast / ETC
- ETC calculated either: Remaining Budget, or manual ETC from PM (based on your methodology)
- EAC = Actual to Date + ETC
- Remaining Profit = (Contract Value Adjusted) − EAC
6) Revenue, Billing & WIP Link
- Billing to Date (invoices/statements) + Collections (collected)
- Under/Over Billing (optional): Revenue Recognized versus Billing
- Support for POC: Cost-to-Cost (optional) for recognized revenue based on completion percentage
7) Project Cash View
- Cash In: Expected/Actual collections by Aging
- Cash Out: Payments (Actual + Forecast) + Near commitments
- Cash Gap: Warning of liquidity gap even if profitability is positive
8) Variance Analysis
- Budget vs Actual (actual variance)
- Budget vs EAC (expected variance at completion)
- Drivers: Scope/Pricing/Productivity/Waste/Delay/Claims/COs
Product Components (Clear Inventory)
-
Project Register
- Project definitions + contract type + client/manager data.
-
Budget / Cost Codes
- Project budget by Cost Codes/Phases.
-
Actual Costs Import
- Monthly upload of actuals with classification and source.
-
Committed Costs (PO Tracker)
- Commitments + remaining commitment + impact on EAC.
-
Forecast / ETC & EAC
- ETC/EAC + Remaining Profit + Margin%.
-
Billing / Collections
- Invoices/statements + collections + Aging.
-
Cash View
- Cash In/Out + liquidity gap + simplified forecasting.
-
Variance & Dashboard
- Variance analysis + dashboard + Alerts.
Suggested Tabs within the Delivery File
- Projects | Budget | Actuals | Commitments | Forecast | Billing | Collections | Cash | Variances | Controls | Dashboard
After Implementation (Only Two Points)
- Understandable and Early Profitability: EAC/ETC clarifies the “expected outcome” before it’s too late, with variance explanation.
- Better Financial and Operational Decision: Balancing profitability and liquidity (Profit vs Cash) to avoid “profitable on paper” projects.
FAQ — Frequently Asked Questions Before Purchase
What is the difference between ETC and EAC?
ETC is the remaining to complete the project (expected future cost).
EAC is the total project cost at completion = Actual to Date + ETC.
Does the report take into account supplier commitments (POs)?
Yes. There is a Commitments tab that displays remaining commitments, for a more realistic profitability estimate even before invoices are recorded.
Can the report be linked to invoices/WIP?
Yes optionally: Input Billing/IPC + Revenue Recognized (if desired) to show Under/Over Billing and read WIP/POC.
Does it support Change Orders?
Yes: You can enter Approved COs and update the contract value, showing the effects on Remaining Profit and Margin.
How do I match it with the General Ledger (GL)?
Recommendation: Upload Actual Costs from the GL statement by Project/Cost Center/Cost Code (or manual aggregation),
then use the Controls tab to verify total actuals against GL (according to your methodology).
Is this a “Dashboard” or an Audit Report?
It is both: A management tracking dashboard + an auditable data structure (Budget/Actual/Committed/Forecast) with alerts and controls.
If you want a clear view: “Is the project profitable? Where is it heading? Is liquidity safe?”
Outputs: Project P&L | EAC/ETC | Variances | Billing/Collections | Cash Gap.
“`
| المسمّى الوظيفي | |
|---|---|
| Duration | |
| المستوى | |
| التحديثات | |
| القطاع | |
| الصيغة |
Related products

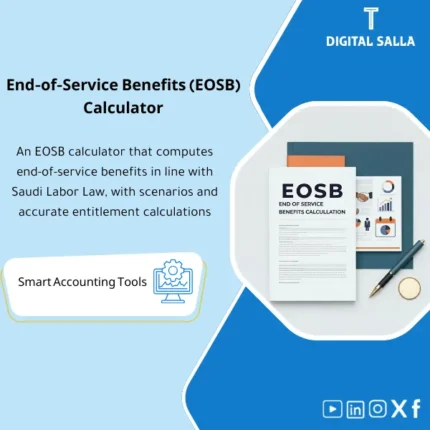
EOSB Calculator – Excel Template

Expected Credit Losses Assessment Service (IFRS 9)
Finance SOPs – Detailed Steps
Sales Controls Template – Excel Template
Sales Control Template is an effective Excel tool to manage and monitor sales invoices and revenue contracts with automated workflows, analytical reports, and charts to help you understand sales performance. Highly flexible and editable to fit your needs—strengthening sales controls and improving performance.
Reviews
Clear filtersThere are no reviews yet.