


Rolling Forecast 12-Month Model – Excel File
127.39 $
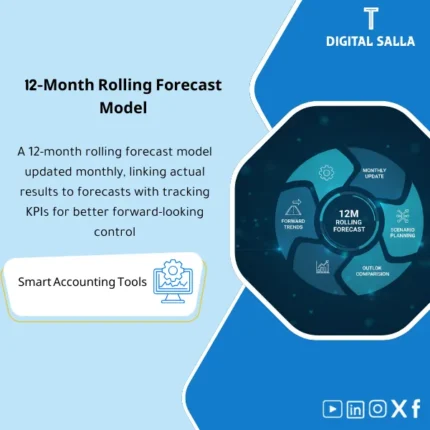
Rolling Forecast (12 Months): Builds a driver-based rolling forecast for sales, costs, and collections with monthly updates (actual vs forecast). Delivers an updated forecast and trend view for continuous planning.
Rolling Forecast (12 Months)
12-Month Rolling Forecast + Drivers + Assumptions Log + Reforecast Workflow + Budget Comparison + Sign-off
Value Proposition: The Rolling Forecast model establishes a “12-Month Forecast” as an updatable monthly process: Actuals (Last closed month) → Drivers & Assumptions → 12M Forecast → Variances vs Budget → Reforecast Actions → Version/Sign-off instead of a Forecast that stops at the first month or changes without an assumptions log.
In 20 Seconds: What Will You Get?
- 12-Month Forecast Grid: Columns for the next 12 months that automatically update after entering the Actual for the closed month.
- Drivers Layer: Adjustable forecast drivers (Volumes/Prices/Headcount/FX/Utilization… based on your activity).
- Assumptions Log: A log of assumptions: What changed? Why? Who approved? And when?
- Reforecast Workflow: Monthly update steps (Input → Review → Freeze → Publish) with Version/Date.
- Forecast vs Budget: Comparison of forecasts to the budget (monthly + YTD) highlighting variances.
- Sensitivity Flags: Tagging sensitive items that significantly change the Forecast (Top drivers).
- Sign-off: Approval of the published forecast version (Prepared/Reviewed/Approved).
CTA related to deliverables: Receive 12-Month Forecast + Drivers + Assumptions Log to update forecasts monthly on an approved version instead of undocumented changes.
Suitable For
- FP&A wants a forecasting model that updates monthly with an assumptions log.
- Financial Controller wants to publish a “single version” forecast after each close with sign-off.
- Budget Owners need to understand the impact of operational changes on the next 12 months.
Not Suitable For
- A company that does not have stable monthly Actuals or does not close a month (the rolling window will not move correctly).
- Anyone wanting a very detailed planning model at the SKU/Customer level without driver data (this requires a deeper segment model).
Without the Model / With the Model (Quick Comparison)
| Item | Without Rolling Forecast | With Rolling Forecast |
|---|---|---|
| Monthly Update | Forecast is outdated, stopping mid-year | 12 months always: a new month automatically comes out every month |
| Reasons | Changes without an assumptions log | Assumptions log + driver tags + version approval |
| Budget Comparison | Superficial or inconsistent comparison | Forecast vs Budget monthly and YTD with highlighted variances |
Before Use: 5 Symptoms Present in Forecasts
- The budget is static, but the Forecast is only updated during a crisis or at quarter-end.
- Forecasts change between multiple versions without Version/Sign-off.
- No assumptions log; difficult to justify “why did the numbers change?”.
- The drivers are unclear: Is the change due to price? Volume? Cost? FX?
- Comparison of Forecast to budget is irregular, causing the “expected gap” to be lost early.
Rolling Forecast: Implementation Method (3 Steps Without Gaps)
Step 1: Establish Actuals and Build Baseline
- Input the Actual for the closed month (from TB/GL or P&L export) and establish “Last Closed Month”.
- Automatically move the 12-month window (adding a new month at the end of the horizon).
- Upload the Budget baseline (if available) to use for comparison and identify the expected gap.
Step 2: Update Drivers & Assumptions
- Update key drivers (Volumes/Prices/Costs/Headcount/FX) according to the latest operational information.
- Document every change in the Assumptions log: What changed? Why? What is the impact? Who approved?
- Run the forecasts and output Forecast vs Budget and Trend for the 12 months.
Step 3: Review + Freeze + Publish
- Review Top drivers and major variances with department heads (Sales/Ops/HR).
- Freeze the month’s version with Version/Date, then issue a “Published” version.
- Sign-off Sign-off (Prepared/Reviewed/Approved) and archive the month’s version for reference.
Product Components (Clear Inventory)
-
Rolling 12-Month Forecast Grid
- Practical Purpose: A 12-month forecast grid that moves automatically after entering the Actual for the closed month.
- When Used: Monthly after Month-End close.
- Output Evidence: A consistently forward-looking monthly forecast (Always 12 months ahead).
-
Drivers Model (Forecast Drivers)
- Practical Purpose: Input operational drivers instead of entering random numbers (Volume/Price/Cost/Headcount…).
- When Used: At every monthly update or when there is a significant change.
- Output Evidence: Clear drivers that can be discussed and linked to results.
-
Assumptions Log
- Practical Purpose: Document the reason for any change in the Forecast, who approved it, and its impact.
- When Used: With every reforecast cycle.
- Output Evidence: A log that can be presented to management when asked “Why did the forecast change?”.
-
Forecast vs Budget Comparison
- Practical Purpose: Highlight the expected gap early (monthly and YTD) instead of discovering it at year-end.
- When Used: Monthly during review.
- Output Evidence: A comparison that can be presented in management meetings.
-
Reforecast Workflow (Review/Freeze/Publish)
- Practical Purpose: Turn the forecast into a process with steps, approvals, and a reference version.
- When Used: Every month.
- Output Evidence: A Published version with Date and Version.
-
Sensitivity Flags (Most Impactful Drivers)
- Practical Purpose: Identify the items that have the most impact on results instead of reviewing everything with the same weight.
- When Used: During monthly or quarterly reviews.
- Output Evidence: A list of Top drivers + their impact on the forecast.
-
Sign-off & Version Control
- Practical Purpose: Establish the reference version that was sent (Version/Date) and who reviewed and approved it.
- When Used: When publishing the monthly forecast.
- Output Evidence: Sign-off that prevents version discrepancies within the team.
CTA related to deliverables: Drivers + Assumptions + Published forecast as a monthly reforecast process subject to internal audit.
What Should Be Included in the Deliverable?
- 01 – Actuals Input: Actual for the closed month (TB/GL export) with extraction date and reference version.
- 02 – Budget Baseline (Optional): Approved budget version for comparison (Account/Month/CC if available).
- 03 – Drivers: Tables of drivers used (volumes/prices/costs/headcount/FX…) with their sources.
- 04 – Forecast Output: 12-month forecast grid + monthly summary + YTD.
- 05 – Forecast vs Budget: Comparison of the expected gap (monthly/YTD) + largest impact items.
- 06 – Assumptions Log: Log of assumptions and changes with impact and approval.
- 07 – Sensitivity List: List of sensitive drivers + their impact (if used).
- 08 – Version & Sign-off: Prepared/Reviewed/Approved + Version/Date for the published month version.
After Implementation (Two Points Only)
- Operational Outcome for the Team: The Forecast becomes a consistent monthly cycle linked to the Actual for the closed month, not a file updated randomly.
- Management Outcome: Management sees the expected gap against the budget early with documented reasons/Drivers, allowing for course correction before year-end.
FAQ — Questions Before Purchase
Is a Budget Required?
No. The Rolling forecast can operate without a budget. However, having a budget helps in comparing the expected gap and measuring performance against the plan.
Is the model driver-based or can numbers be entered directly?
It is designed to be driver-based, but numbers can be entered directly for certain items. The value is higher when drivers are clear and measured.
Is it suitable for multi-branch companies?
Yes, if Actuals and Budget can be separated by branch/Cost center. Forecasts can be made for each branch and then aggregated for the total company.
Does it support weekly updates?
The rolling approach is monthly after Month-End. Updates can be made within the month on drivers, but the official version is typically published monthly with sign-off.
Does it integrate with the Budget vs Actual Template?
Yes. BvA provides explanations for variances for the closed month, and the Rolling forecast translates this change into forecasts for the upcoming months with an assumptions log.
Does it produce Cash/Working capital forecasts?
The model focuses on operational/financial forecasts in general. Drivers for liquidity and working capital can be added if your data is available (AR/AP/Inventory assumptions).
How is the final version established?
Through Workflow: Review → Freeze → Publish with Version/Date and Sign-off (Prepared/Reviewed/Approved).
What is the minimum data required to get started?
Monthly Actuals (at least P&L) + definition of key drivers affecting revenues and costs + month-end closing date.
Ready to Perform Monthly Reforecast for the Next 12 Months?
You will receive: 12M forecast grid + drivers model + assumptions log + forecast vs budget + sign-off as an updatable and archivable rolling forecast template.
| المسمّى الوظيفي | |
|---|---|
| Duration | |
| المستوى | |
| التحديثات | |
| القطاع | |
| الصيغة |


Reviews
Clear filtersThere are no reviews yet.