

Financial planning for major projects (a factory, hotel, hospital, branch network or large technology platform) turns the project idea into a financial model that links capital expenditure, operations, working capital and funding, and then uses it to make the investment decision and to control execution. A mistake here is not a minor discrepancy: it is a wrong investment decision, a cash shortfall or a delay that raises the cost.
1) Why is financial planning for major projects different?
A small business is often run on "revenue − expenses = profit". A major project combines a large capital outlay, a construction period, risks, funding and a gradual ramp-up, so its plan must answer three questions:
- Is the project worth the investment? A decision before spending, using net present value, internal rate of return and scenarios.
- Is there enough liquidity throughout execution? The timing of cash flows and working capital.
- How do we prevent cost overruns? Governance, budget control and approvals.
A project that is profitable on paper can still fail because of cash timing, or because cost overruns went unmonitored during execution.
2) Project planning within the FP&A function
Financial planning and analysis (FP&A) is a function within finance that turns financial and operating data into plans, forecasts, explanations and recommendations. It does not stop at reporting what happened: it explains why it happened, what is expected to happen, and what the best decision is now. Its cycle in brief: Plan → measure the Actual → Explain → Act → Learn (improve the plan). In a major project, this team owns the financial model, its updates and the variance reports.
| Dimension | Financial accounting | Financial planning and analysis (FP&A) |
|---|---|---|
| Time | The past: what happened in the period | The present and the future |
| Question | What happened? | Why did it happen? What will happen? What do we do? |
| Outputs | Financial statements and periodic closes | Plans, forecasts, variance analysis, scenarios and recommendations |
| Presentation | Formal reports that follow the Standards' presentation requirements | Decision-focused presentation with options |
| Measure of success | Accuracy and closing on time | Quality of decisions and speed of response |
The Conceptual Framework distinguishes the users of general purpose financial reports from management: the objective of general purpose financial reporting is to provide financial information useful to existing and potential investors, lenders and other creditors in making decisions relating to providing resources to the entity, whereas management need not rely on those reports because it is able to obtain the financial information it needs internally (Conceptual Framework, paragraphs 1.2 and 1.9).
3) Scope: capital expenditure, operating expenditure and working capital
Before building the model, standardise the definitions, so construction costs are not mixed with operating costs, inflating profit or hiding funding needs. How these items are treated in the financial statements is set by the Standards:
| Item | Examples | Treatment in the financial statements |
|---|---|---|
| Capital expenditure (CAPEX) | Land, buildings, production lines and equipment, plus directly attributable costs such as site preparation, installation, testing whether the asset functions properly and professional fees | Added to the cost of the asset (IAS 16.16–17), then its depreciable amount shall be allocated on a systematic basis over its useful life (IAS 16.50); land has an unlimited useful life and is not depreciated, with exceptions such as quarries and landfill sites (IAS 16.58) |
| Operating expenditure (OPEX) | Operating salaries, energy, day-to-day maintenance and marketing | An expense in profit or loss, including the costs of day-to-day servicing of an asset, which are recognised in profit or loss as incurred (IAS 16.12). In a factory, however, costs of conversion such as direct labour and a systematic allocation of production overheads first enter the cost of inventories (IAS 2.12); when the inventories are sold, their carrying amount shall be recognised as an expense in the period in which the related revenue is recognised (IAS 2.34) |
| Working capital | Inventories + receivables − payables | Not in the income statement, but sales growth can consume cash instead of generating it |
Four points that need care in project models:
- Pre-opening costs: costs of opening a new facility, introducing a new product or service (including advertising and promotion), conducting business in a new location or with a new class of customer (including staff training), and administration and other general overheads are not costs of property, plant and equipment (IAS 16.19). Start-up expenditure, unless it is included in the cost of an item of property, plant and equipment under IAS 16, and training, advertising and promotional expenditure are examples of expenditure recognised as an expense when incurred (IAS 38.69), so plan them as expenses.
- Ramp-up: recognition of costs in the carrying amount of an asset ceases when it is in the location and condition necessary for it to be capable of operating in the manner intended by management. Costs incurred while an asset capable of operating in that manner has yet to be brought into use or is operated at less than full capacity are not capitalised, nor are initial operating losses, such as those incurred while demand for its output builds up (IAS 16.20).
- Borrowing costs: an entity shall capitalise borrowing costs directly attributable to the acquisition, construction or production of a qualifying asset, an asset that necessarily takes a substantial period of time to get ready for its intended use or sale, and shall recognise other borrowing costs as an expense in the period in which it incurs them (IAS 23.5, 8). Interest attributable to a qualifying asset during construction raises its cost in the statements but remains a cash outflow in the model; see IAS 23 Borrowing Costs.
- Leases: at the commencement date a lessee shall recognise a right-of-use asset and a lease liability (IFRS 16.22), and may elect not to do so for short-term leases and leases of low-value assets (IFRS 16.5). A lease is therefore not always an operating expense in the statements, although its payments remain cash outflows in the model; see IFRS 16 Leases.
For the practical line between an asset and an expense, see Capitalisation rules.
4) The cash flow model: traceable, auditable layers
Build the model in layers, and never enter a lump-sum figure without a source.
4.1 Assumptions layer
- Operating capacity and the ramp-up plan.
- Prices, sales volume and seasonality.
- Fixed and variable cost structure.
- CAPEX items with a monthly or quarterly spending schedule.
- Collection and payment cycles (DSO and DPO) and their effect on working capital.
4.2 Revenue and cost layer
Build revenue from drivers (units × price) rather than a final figure, link variable costs to the same drivers (materials, energy, transport), and add fixed costs.
4.3 Cash flow layer
- Operating cash flow: operating profit after tax + depreciation ± the change in working capital.
- Investing cash flow: CAPEX and later additions, less sale or salvage proceeds at the end of the life.
- Funding: loans, principal and interest repayments and dividends, in a separate layer.
Investment metrics are usually computed on the project's free cash flow before financing, not on accounting profit; the funding structure's capacity to service debt is then tested in its own layer. To read cash flows in actual statements, see Statement of cash flows.
5) Decision metrics: NPV, IRR, payback and profitability index
Do not rely on a single metric; each one has its own angle:
| Metric | Idea | When does it mislead? |
|---|---|---|
| Net present value (NPV) | The present value of net cash flows discounted at the required rate of return | When the discount rate is unrealistic or the cash flows are inflated |
| Internal rate of return (IRR) | The rate that makes NPV zero | It ignores project size, and there may be several or none if the cash flows change sign more than once |
| Payback period | The years needed to recover the investment in cash | It ignores flows after payback and the time value of money |
| Profitability index (PI) | Present value of inflows ÷ initial investment | Not enough on its own without size and risk |
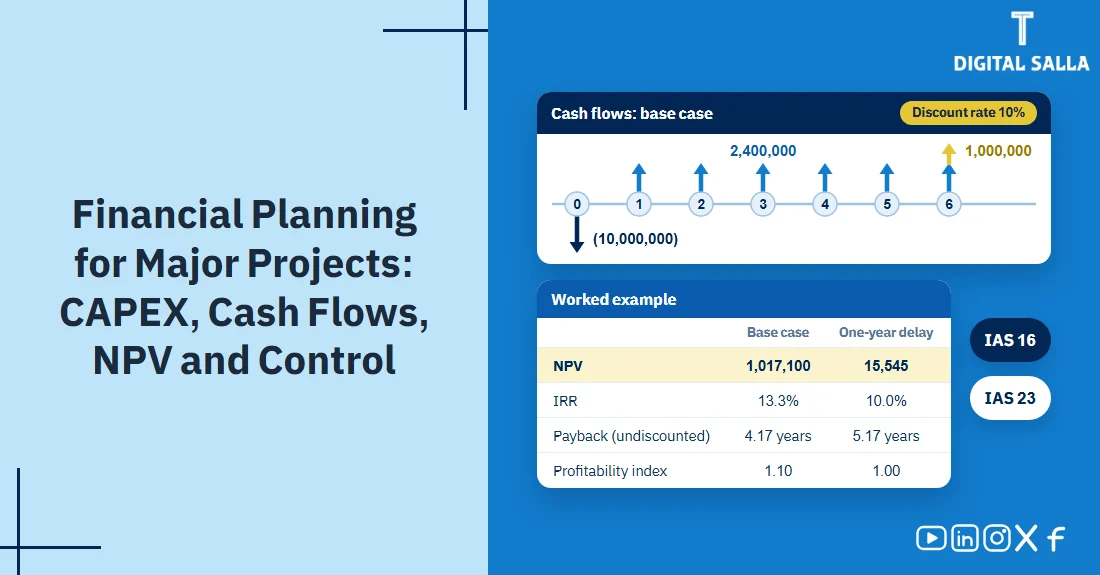
Worked example (illustrative figures)
Assumptions: an initial investment of 10,000,000 in year 0, after-tax free cash flow of 2,400,000 a year in years 1 to 6, a salvage value of 1,000,000 at the end of year 6, a 10% discount rate, and all cash flows at year-end. In the delay case operations start one year later (cash flows in years 2 to 7, salvage at the end of year 7) with the same investment in year 0.
| Metric | Base case | One-year delay |
|---|---|---|
| Present value of inflows | 11,017,100 | 10,015,545 |
| NPV | 1,017,100 | 15,545 |
| IRR | 13.3% | 10.0% |
| Payback (undiscounted) | 4.17 years | 5.17 years |
| Profitability index | 1.10 | 1.00 |
In the base case NPV is positive and the IRR is above the discount rate. A one-year delay in operations, with no increase in cost, cuts NPV by about 98% and brings the IRR close to the discount rate. For more on these metrics, see Feasibility studies using NPV and IRR.
6) Sensitivity and scenarios before spending
Test how sensitive the results are to the key variables: price, volume, cost, delay, interest rates and, where relevant, exchange rates. Typical questions:
- Price down or up 5%: what happens to NPV?
- Sales volume down 10%: does the model hold?
- CAPEX up 15% because of engineering changes: is the funding enough?
- A six-month delay in operations: how much extra liquidity does the project need?
Then build at least three scenarios, and test the decision on the downside scenario too, not only on the base case:
| Scenario | Assumptions | Initial decision |
|---|---|---|
| Base | Expected volume, stable cost, on-time start of operations | Move to contracting and procurement |
| Downside | Delay, higher CAPEX and lower volume | Change the design or scope, or secure extra funding on clear terms |
| Upside | Higher volume and operating efficiency | Phased expansion instead of full expansion from the start |
Building sensitivities and scenarios in detail is covered in Sensitivity analysis.
7) Governance and control during execution
Once the project is approved, the risk of overruns begins. Financial control rests on a spending cap, authorities, variance reports and change management:
- Coded cost items: the project is broken into measurable cost codes (civil, electrical, mechanical, IT…).
- Commitments: contracted purchases are tracked before they become actual expenses.
- Budget vs actual vs forecast: the variances and the updated estimate at completion.
- Change orders: every scope change goes through financial approval.
The FP&A team uses three complementary tools, each with its own purpose:
| Tool | Purpose | Update frequency | Best use |
|---|---|---|---|
| Budget | Set targets, spending and limits | Annual, with limited revisions | Governance and resource allocation |
| Forecast | Expected year-end result based on actuals | Monthly or quarterly | Early correction before year-end |
| Rolling forecast | A continuous forecast for a fixed number of months ahead | Monthly or weekly, depending on the business | Changing environments and fast decisions |
The building blocks are in Master budget preparation and Rolling forecasts, and explaining variances in Variance analysis. Measuring actual spend alone, without commitments, can reveal a budget overrun too late.
8) Funding: debt, equity and repayment schedules
Funding affects monthly liquidity, the project's ability to service debt, and its exposure to interest rate risk. Questions the model must answer:
- What debt-to-equity ratio suits the project's risk?
- Does repayment start during construction or after operations begin (a grace period)?
- Is the interest fixed or floating, and what is the effect of a two-percentage-point rise?
- Does the loan agreement include covenants, such as a debt service coverage ratio (DSCR) or leverage limits?
Profitability alone is not enough: make sure monthly cash flows can carry instalments and interest without heavy pressure on operations. See Strategies for reducing financing costs and Advanced liquidity analysis.
9) Common mistakes in project financial planning
- Mixing CAPEX and OPEX: distorts profit and the metrics.
- Ignoring working capital: higher sales can mean less cash with slow collections or excess inventory.
- An annual-only model: the construction period needs monthly cash flows.
- Changes without financial approval: change orders pile up without control.
- An unreasonable discount rate: flatters NPV and leads to a wrong decision.
- No updated forecast: the budget alone is not enough.
Delay is not only an operational problem: it stretches CAPEX spending, defers revenue and adds financing cost; the example showed the effect of deferring the inflows by a single year alone, with no added cost.
10) Frequently asked questions
Is accounting profit enough for an investment decision?
No. The decision depends on cash flows, their timing and their risk, which is why metrics such as NPV and IRR are used.
When should NPV take precedence over IRR?
When choosing between mutually exclusive projects (only one can be selected) that differ in size or in the timing of their cash flows, because NPV measures the value added in currency. When capital is limited in a single period across independent projects, ranking them by profitability index helps.
Should the model be monthly or annual?
At least monthly during execution, because spending and funding happen over short periods. Once operations are stable it can be summarised annually, keeping monthly detail for sensitivity tests.
Sources
- IFRS Foundation: IAS 16 Property, Plant and Equipment. References in brackets are to paragraphs of the Standards.
- IFRS Foundation: IAS 2 Inventories, IAS 23 Borrowing Costs, IAS 38 Intangible Assets and IFRS 16 Leases.
- IFRS Foundation: Conceptual Framework for Financial Reporting.